


Prediction: This Unstoppable Vanguard ETF Will Crush the S&P 500 in the Remainder of 2026
Key Points
The S&P 500 Growth index usually outperforms the regular S&P 500 because of more exposure to tech.
The Vanguard S&P 500 Growth ETF mimics the performance of the Growth index by holding the same stocks.
The ETF beat the S&P 500 in the first half of 2026, and it could extend its advantage in the remainder of the year.
- 10 stocks we like better than Vanguard Admiral Funds - Vanguard S&P 500 Growth ETF ›
Had you invested in an S&P 500 (SNPINDEX: ^GSPC) index fund at the beginning of 2026, you would have had a 9.5% gain during the first half of the year. But had you parked your money in the Vanguard S&P 500 Growth ETF (NYSEMKT: VOOG) instead, you would have gained 11.5% during the same period.
The S&P 500 is made up of 500 companies from 11 different industry sectors, so it's highly diversified. The Vanguard S&P 500 Growth ETF is an exchange-traded fund (ETF) that mimics the S&P 500 Growth index, which holds only 148 of the best-performing growth stocks from the regular S&P 500, while disregarding the other 352 stocks.
Missed Nvidia in 2009? This Rare Signal Is Flashing Again. In 2009, a "Double Down" signal flashed for a little-known chipmaker called Nvidia. For the first time in years, that same "Total Conviction" signal is flashing for a company 1/100th the size of Nvidia. Continue »
As a result, the ETF tends to outperform the S&P 500 on a consistent basis, and here's why I predict that trend will continue as 2026 draws to a close.

Image source: Getty Images.
Betting on America's top growth stocks
The S&P 500 Growth index chooses stocks based on factors such as their momentum, and the sales growth of the underlying companies. The Vanguard ETF has 52% of its assets parked in the information technology sector right now, because its constituents have momentum and sales growth in spades thanks to the artificial intelligence (AI) boom. By comparison, the S&P 500 has just 38% of its assets parked in tech.
In fact, each of the Vanguard ETF's top 10 holdings participate in the AI race in one way or another, and the fund assigns them much higher weightings than does the S&P 500.
|
Stock |
Vanguard ETF Weighting |
S&P 500 Weighting |
|---|---|---|
|
1. Nvidia (NASDAQ: NVDA) |
13.64% |
7.51% |
|
2. Alphabet (NASDAQ: GOOG)(NASDAQ: GOOGL) |
10.60% |
5.84% |
|
3. Microsoft (NASDAQ: MSFT) |
7.80% |
4.30% |
|
4. Apple (NASDAQ: AAPL) |
5.98% |
6.59% |
|
5. Broadcom (NASDAQ: AVGO) |
5.03% |
2.77% |
|
6. Micron Technology (NASDAQ: MU) |
3.66% |
2.02% |
|
7. Meta Platforms (NASDAQ: META) |
3.48% |
1.92% |
|
8. Amazon (NASDAQ: AMZN) |
3.48% |
3.62% |
|
9. Eli Lilly (NYSE: LLY) |
2.67% |
1.47% |
|
10. Advanced Micro Devices (NASDAQ: AMD) |
2.67% |
1.47% |
Data source: Vanguard. Portfolio weightings are accurate as of June 30, 2026, and are subject to change.
Those 10 stocks were a mixed bag in terms of performance during the first half of 2026, but on average, they produced a 49% return. Therefore, since the Vanguard ETF assigns them higher weightings than the S&P 500, its outperformance since the start of the year is no surprise.
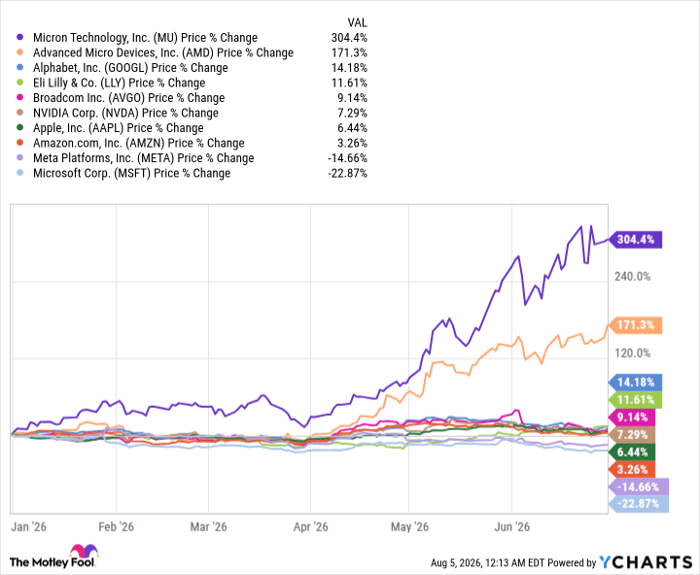
MU data by YCharts
The biggest laggard of the group, Microsoft, has bounced back to start the second half of 2026, with a gain of 28% since June 30 thanks to blockbuster second-quarter operating results. Amazon stock has soared by 15% because of its own stellar Q2 results.
Concerns about the sustainability of the AI infrastructure spending boom have triggered some volatility in chip stocks such as Nvidia, Broadcom, Micron, and AMD during the past couple of months. However, some of their largest customers have shown no desire to pull back on their investments in data centers, so each of those stocks could rally nicely into year's end.
The Vanguard ETF has an excellent track record against the S&P 500
Zooming out and looking at the longer term, we see the Vanguard S&P 500 Growth ETF has delivered a compound annual return of 16.7% since it launched in 2010, beating the S&P 500, which climbed by an average of 14.2% per year during the same period.
Although that 2.5 percentage-point difference might not sound overly significant, it would have made a serious impact in dollar terms thanks to the magic of compounding.
|
Starting Balance In 2010 |
Compound Annual Return |
Balance In 2026 |
|---|---|---|
|
$50,000 |
16.7% (Vanguard ETF) |
$591,702 |
|
$50,000 |
14.2% (S&P 500) |
$418,434 |
Data source: author.
Therefore, although the Vanguard ETF can certainly continue pulling away from the S&P 500 in the remainder of 2026, investors who focus on the long term could reap the biggest rewards.
Should you buy stock in Vanguard Admiral Funds - Vanguard S&P 500 Growth ETF right now?
Before you buy stock in Vanguard Admiral Funds - Vanguard S&P 500 Growth ETF, consider this:
The Motley Fool Stock Advisor analyst team just identified what they believe are the 10 best stocks for investors to buy now… and Vanguard Admiral Funds - Vanguard S&P 500 Growth ETF wasn’t one of them. The 10 stocks that made the cut could produce monster returns in the coming years.
Consider when Netflix made this list on December 17, 2004... if you invested $1,000 at the time of our recommendation, you’d have $400,155!* Or when Nvidia made this list on April 15, 2005... if you invested $1,000 at the time of our recommendation, you’d have $1,345,502!*
Now, it’s worth noting Stock Advisor’s total average return is 955% — a market-crushing outperformance compared to 214% for the S&P 500. Don't miss the latest top 10 list, available with Stock Advisor, and join an investing community built by individual investors for individual investors.
See the 10 stocks »
*Stock Advisor returns as of August 7, 2026.
Anthony Di Pizio has no position in any of the stocks mentioned. The Motley Fool has positions in and recommends Advanced Micro Devices, Alphabet, Amazon, Apple, Broadcom, Eli Lilly, Meta Platforms, Micron Technology, Microsoft, and Nvidia. The Motley Fool has a disclosure policy.
Recommended Articles


