

Warning: The S&P 500 Could Be on the Verge of Doing Something for the First Time in 155 Years, and It's Not Good News for Investors
Key Points
The CAPE ratio is a useful valuation metric that accounts for long-term earnings growth.
The ratio is currently sustaining a level above 40 for the first time since the dot-com era.
At its current pace, the CAPE ratio could propel to its highest levels in 155 years.
- 10 stocks we like better than S&P 500 Index ›
With all of the volatility in the stock market this year, most investors probably don't realize the S&P 500 (SNPINDEX: ^GSPC) is sitting at a precarious peak. The index's cyclically adjusted price-to-earnings (CAPE) ratio now hovers near a reading of 41 -- a territory that historically signals serious trouble ahead.
The CAPE ratio captures something deeper than daily price movements: It reveals how much investors are willing to pay for every dollar of long-term earnings power. At its current level, the S&P 500 appears to be pricing in unprecedented levels of optimism while quietly laying the foundation for a painful reckoning.
Where to invest $1,000 right now? Our analyst team just revealed what they believe are the 10 best stocks to buy right now, when you join Stock Advisor. See the stocks »
All told, the index looks like it's on a collision course with economic reality, and history suggests the landing may be rough. Read on to learn why.

Image source: Getty Images.
What is the CAPE ratio and why does it matter?
The CAPE ratio was originally developed by economist Robert Shiller. The metric divides the current S&P 500 price by the average inflation-adjusted earnings per share (EPS) over the previous 10 years. By doing so, the CAPE ratio smooths out any temporary spikes or dips caused by recessions, economic booms, or one-time events. This approach gives a clearer picture of sustainable valuation across the index as a whole.
At face value, the price-to-earnings ratio can appear deceptively attractive in years of strong profitability. But the CAPE forces investors to look across full business cycles. The underlying data for the CAPE ratio stretches back to 1871 -- more than 155 years of market history.
Across that span, the long-term average CAPE has hovered between 17 and 18. As the chart indicates, when the CAPE ratio climbs well above the 25 to 30 range, it has repeatedly warned that future stock returns will be disappointing.
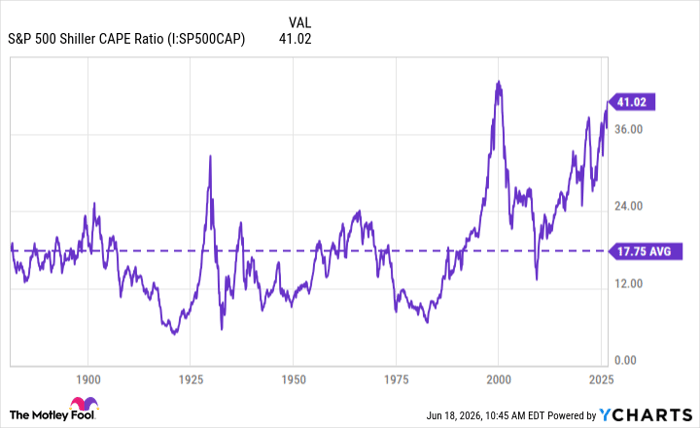
S&P 500 Shiller CAPE Ratio data by YCharts.
At today's reading of 41, the S&P 500 is not merely expensive by historical standards -- it suggests the market is in an extreme zone where patience and realism become essential. While the CAPE ratio falls short of predicting exact timing, it has a flawless ability to show when risk accumulates and the margin of safety starts to disappear.
Analyzing historical CAPE readings
There are only a handful of periods where investors have witnessed the CAPE ratio sustain levels between 30 and 40. The common theme is that each time it ended badly.
During the late 1920s, valuations soared into this range amid roaring economic confidence, only to collapse into the Great Depression and a brutal bear market. In the late 1990s, the CAPE ratio soared to 44 at the peak of dot-com euphoria. Shortly thereafter, the Nasdaq Composite lost more than three-quarters of its value, and the broader market suffered years of stagnation.
The S&P 500 has spent the majority of its existence trading at reasonable multiples. According to historical data, the CAPE ratio remained above 30 only in three distinct episodes: the dot-com bubble, the post-Great Financial crisis in 2018, and the post-COVID bull market (starting in 2021).
Today's reading of 41 is the second-highest in recorded history -- surpassed only by the dot-com era. While the CAPE has briefly reached these heights at other times, sustained readings at this elevated level are extraordinarily rare. Smart investors understand that the current detachment from historical norms is not normal market behavior. Rather, it is an outlier that deserves careful attention.
What does a rising CAPE ratio signal for future market returns?
A rising CAPE ratio means that investors are paying higher prices for the same underlying earning power. In essence, it reflects optimistic sentiment fueled by a variety of things like new technologies (i.e., artificial intelligence), easy credit, or a belief that "this time is different."
History shows that such enthusiasm eventually ends up colliding with reality. From slowing earnings growth, adjustments in monetary policy, or unexpected macroeconomic events, smart investors understand that businesses still operate in a world filled with uncertainty.
At its current reading, expectations embedded in the S&P 500 are exceptionally high. Even a modest disappointment in profit growth from major corporations or a shift in the Federal Reserve's outlook could trigger a sharp repricing.
While none of this guarantees a sudden crash, the probability of more modest long-term returns is rising dramatically. Past episodes at similar valuations have produced flat or negative real returns over the following decade, often accompanied by stomach-churning drawdowns along the way.
Investors would be wise to temper their enthusiasm with some disciplined strategies. Building a diversified portfolio featuring blue chip companies with durable and resilient business models is a good place to start. Supplementing these positions with a healthy cash balance will also provide financial flexibility to buy dips when they occur.
The key to remember here is that the S&P 500 has delivered generational wealth over several decades precisely because it eventually corrects its excesses. While the current CAPE reading is not a reason for immediate panic, it should call for caution and perspective. After 155 years of market history, it's clear how this story could end.
Should you buy stock in S&P 500 Index right now?
Before you buy stock in S&P 500 Index, consider this:
The Motley Fool Stock Advisor analyst team just identified what they believe are the 10 best stocks for investors to buy now… and S&P 500 Index wasn’t one of them. The 10 stocks that made the cut could produce monster returns in the coming years.
Consider when Netflix made this list on December 17, 2004... if you invested $1,000 at the time of our recommendation, you’d have $417,305!* Or when Nvidia made this list on April 15, 2005... if you invested $1,000 at the time of our recommendation, you’d have $1,293,148!*
Now, it’s worth noting Stock Advisor’s total average return is 936% — a market-crushing outperformance compared to 209% for the S&P 500. Don't miss the latest top 10 list, available with Stock Advisor, and join an investing community built by individual investors for individual investors.
See the 10 stocks »
*Stock Advisor returns as of June 21, 2026.
Adam Spatacco has no position in any of the stocks mentioned. The Motley Fool has no position in any of the stocks mentioned. The Motley Fool has a disclosure policy.
Recommended Articles


