

SpaceX (SPCX) Hits $199 and a $2 Trillion Valuation — Can the Rally Reach $223?
TradingKey - SpaceX (NASDAQ: SPCX) currently trades at $199.21 on June 16, having broken through the 1.618 Fibonacci extension level of $201.22 on the one-hour chart after standing firm off of the 1.0 base in the $149.83 range. The stock has surged parabolically, jumping from its $135 IPO price to close to $200 in three trading sessions. With RSI at 79.85, the stock is technically overbought, yet it shows no signs of bearish divergence and momentum remains intact.
The shares of the rocket company climbed 19.6 percent during the June 15 session, closing at $192.50 and driving SpaceX’s market capitalization over $2 trillion. This puts the spaceflight manufacturer as more valuable than two of the largest global companies by market cap. Mining billionaire Gina Rinehart of Australian company Hancock Prospecting has revealed it has invested in SpaceX’s IPO, which may mean the two entities could partner on important issues regarding critical minerals.
For SPCX stock at $199, the issue isn’t whether the fundamentals justify the premium (they clearly do) but whether this particular pace of movement is sustainable prior to the supply event the stock has yet to meaningfully factor into its price structure.
RSI 79 and the Float Wall — Why This Rally Has a Calendar Attached
A three-session price swing from $150 to $199, which is about a 33 percent increase over a week of trading, represents price movement explainable by the supply side rather than a fundamentals-based re-rating. SpaceX IPO’d with a free float of roughly 4 percent, leaving the other 96 percent under a 180-day insider lockup. Every share in circulation has been pulled from that 4 percent available supply. Thus, the kind of demand SpaceX is seeing, including retail enthusiasm, MSCI fund buy programs, and momentum traders chasing the price, is absorbing the existing float that cannot be expanded. A 79 RSI is the technical manifestation of that specific demand-and-supply relationship: A price moving higher and faster over a three-day period than the fundamentals would suggest based on the available demand.
Perhaps even more important, the structural detail to consider is the potential for float expansion from December 2026 when the 180-day lockup expires. Or more immediately, when the September 2 earnings date draws investor interest away from the mechanics of the stock offering to the specifics of quarterly results. SPCX stock analyses on trading platforms are already labeling the spaceflight firm’s stock as a demand-and-supply play with a fixed deadline more than they are a fundamental play. The window to hold a long position aggressively will last as long as there are insiders unable to sell, and float expansion is the biggest single risk to the current structure of the share price. This isn’t to suggest the rally is misplaced. Basically, the risk of staying in the stock at $199 isn’t the same as the risk once the float settles.
What Hasn’t Changed — Starlink, Starship, and the Fundamentals Behind the Move
Nothing much about the core fundamentals has changed since the IPO. Starlink has crossed the 10 million user mark, bringing in over $700 million in monthly revenue that’s still growing fast. Analysts are forecasting Starlink will hit between $9 and $12 billion in annual revenue by the end of 2026, with EBITDA margins in the 60 to 70 percent range.
Starship development remains on course for full reusability, with SpaceX aiming for uncrewed lunar flights in support of NASA’s Artemis program later in 2026. That, combined with a $4.2 billion+ NASA contract haul and a more than $8.5 billion government and national security contract backlog, means SpaceX has revenue that’s structurally insulated from how Starlink does as a commercial business. No, these things don’t account for a 33 percent move over three days. They account for the valuation premium, and the three days’ speed represents a supply/constrained float on top of a really good story.
Now, add a Hancock Prospecting disclosure, which means SpaceX may get access to one of the world’s biggest private miners to explore and/or extract critical minerals. That is directly relevant to the kind of long-term use case Starship is supposed to play a role in, the type that requires in-space extraction or utilization of resources, and part of SpaceX’s larger vertical integration in manufacturing. Not a lot when you weigh it against Starlink revenues. But it’s another sign of people who are willing to come in to an IPO that aren’t just getting whatever the usual institutional roadshow gives them.
SPCX Technical Setup — 1.618 Fib Cleared at $201, RSI Overbought, Targets $211.60 and $222.77
The 1H shows SPCX at $199.21, just past the 1.618 Fib extension at $201.22 from the $149.83 base, with lots of green bodies and little in the way of red overlap. RSI sits at 79.85. It’s overbought, but there’s no signs of imminent divergence to signal a pullback. FOMO-driven buying can drive an overbought RSI to stick around for quite a while, but the next references are the 2.0 Fib extension at $211.56 and both the 2.272 and 2.414 extensions at $222.77.
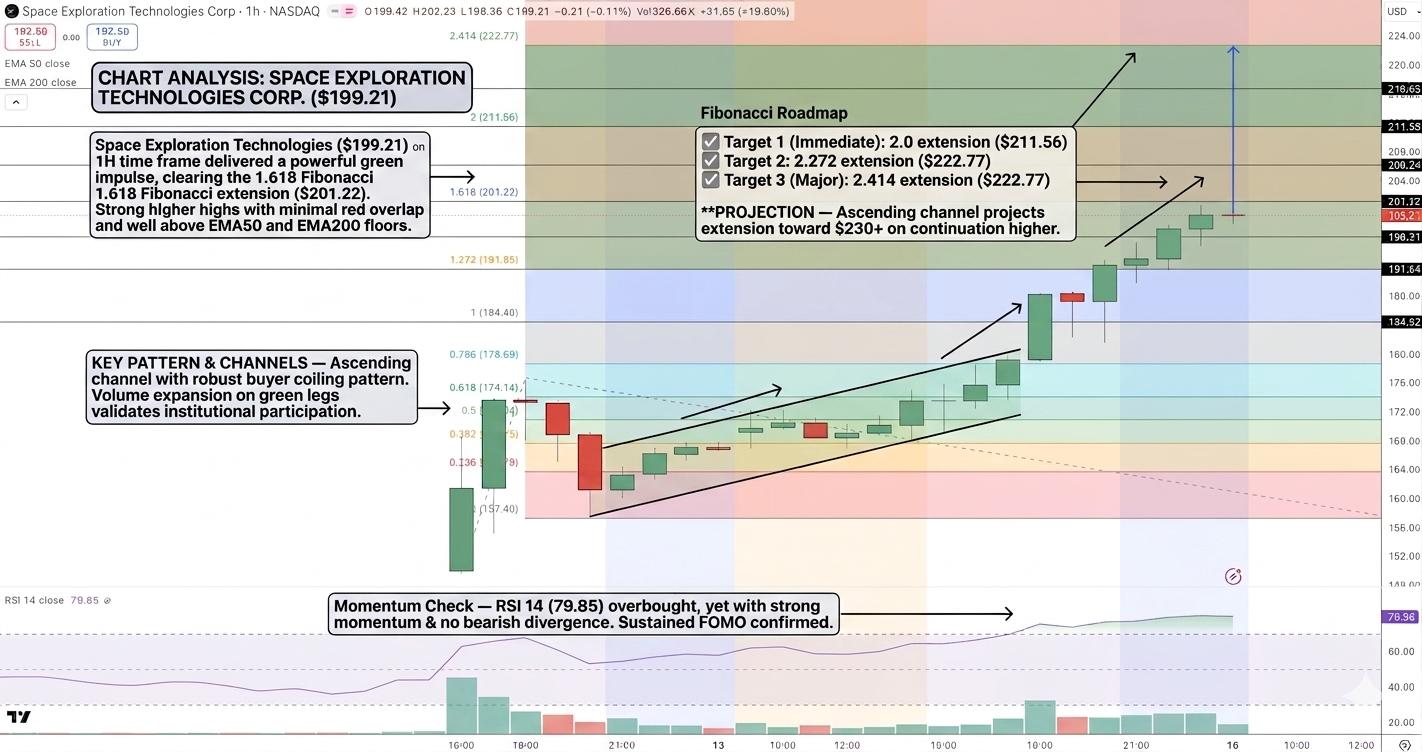
If the move continues, the channel points toward $230-plus. RSI readings above 79 suggest a pullback or at least a bit of consolidation to set up the next move is the most likely outcome in the near term, and if it does come, $191.80 represents the point at which a portion of the recent gains is returned.
- Entry: Long above $201.20, 1.618 extension confirmed.
- Target 1: $211.60, 2.0 Fib extension.
- Target 2: $222.77, 2.272/2.414 Fibs.
- Caution: RSI 79.85 overbought, risk of pullback/consolidation before next move.
- Stop Loss: Close below $191.80, swing support fails.
- Structural: 180-day insider lockup expires December 2026, potential supply spike.
Bottom Line
bullishness behind Starlink and Starship is amplified to a 33% rally in a span of just three days because the free float is merely roughly 4% of total shares. Although the June 15 close at a $2 trillion market cap and the Hancock Prospecting purchase strengthen the bullish outlook, neither will change the supply/demand mechanics.
While trading above $201.20 signals targets of $211.60 and $222.77, the overbought RSI indicates it might not be a good idea to enter at this point, and the $191.80 support area should be watched in case of a retracement. The 180-day insider lockup ending in December 2026 and September 2 earnings will be the two key catalysts as to whether this rally continues as the float returns to normal.
Recommended Articles


