

If the S&P 500's Pullback Turns Into a Full-Fledged Bear Market, It Would Be Statistically Unique, According to 76 Years of Data
Key Points
Recently, the Dow Jones Industrial Average and Nasdaq Composite dipped into correction territory, while the S&P 500 pulled to within a stone's throw of a double-digit decline.
The leading bear market catalyst for the S&P 500 would be a shift in the Federal Reserve's monetary policy.
Every S&P 500 bear market since 1950 has swiftly moved lower, with investors' emotions often exacerbating these short-term declines.
- 10 stocks we like better than S&P 500 Index ›
Until recently, Wall Street's benchmark indexes were seemingly unstoppable. Over the last six months, the S&P 500 (SNPINDEX: ^GSPC), Nasdaq Composite (NASDAQINDEX: ^IXIC), and Dow Jones Industrial Average (DJINDICES: ^DJI) touched psychologically important plateaus of 7,000, 24,000, and 50,000, respectively.
But what a difference six weeks has made! Since the start of the Iran war on Feb. 28, the Dow and Nasdaq Composite have briefly dipped into correction territory, while the benchmark S&P 500 has stood a stone's throw away from joining them.
Will AI create the world's first trillionaire? Our team just released a report on the one little-known company, called an "Indispensable Monopoly" providing the critical technology Nvidia and Intel both need. Continue »

Image source: Getty Images.
This pullback has some investors questioning whether the S&P 500's drop will turn into a full-fledged bear market -- a 20% (or greater) decline from its closing high. Based on 76 years of S&P 500 bear market data, the benchmark index would be making history if this were to happen.
If an S&P 500 bear market takes shape, the Fed would likely be the catalyst
If there's a prevailing catalyst for an S&P 500 bear market, it'd be a change of course for America's foremost financial institution, the Federal Reserve.
Since September 2024, the central bank has lowered the federal funds target rate six times. Lower interest rates make borrowing more enticing for businesses, leading to hiring, acquisitions, and an uptick in innovation.
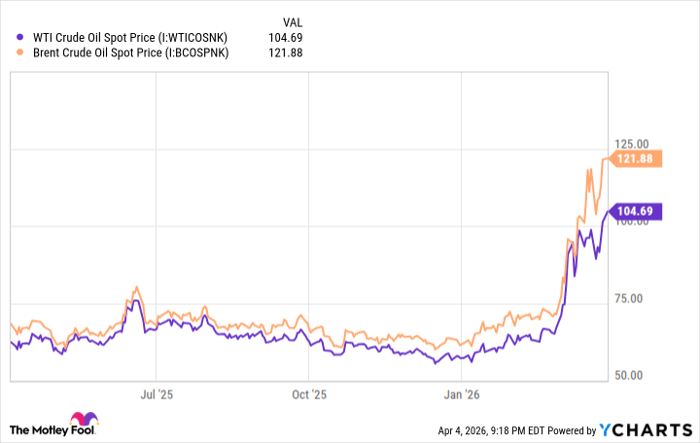
WTI Crude Oil Spot Price data by YCharts.
But the Iran war is throwing a monkey wrench into the Fed's rate-easing cycle. Iran's closure of the Strait of Hormuz to most oil exports has sent crude oil prices skyrocketing. Consumers are feeling the pinch at the pump, while businesses are likely to see their supply chain and production costs rise. According to the Federal Reserve Bank of Cleveland's Inflation Nowcasting tool, the trailing 12-month inflation rate is estimated to climb 85 basis points, from 2.40% in February to 3.25% in March.
If Fed Chair Jerome Powell and the other members of the Federal Open Market Committee are concerned about the rapid rise in aggregate prices, they may halt their rate-easing cycle and/or introduce the possibility of future rate hikes. This would be a potentially devastating outlook for a historically expensive stock market.

Image source: Getty Images.
Bear markets begin swiftly and are typically driven by emotional trading
While there's certainly a catalyst capable of sending the S&P 500 down 20% (or more), it's statistically unlikely that the current pullback will turn into a bear market decline.
According to data aggregated by Carson Investment Research and posted by Carson Group's Chief Market Strategist, Ryan Detrick, bear markets tend to happen swiftly. The 11 S&P 500 bear markets since the start of 1950 saw their initial 5% declines occur over an average of 14.5 trading days (about three weeks).
Could the S&P 500 go down 20%?
-- Ryan Detrick, CMT (@RyanDetrick) March 31, 2026
Anything is possible, but looking at the other 11 bear markets since the S&P 500 became 500 stocks shows that they usually start with a quick drop from ATHs.
In fact, down 5% in only 14.5 days on avg those times.
The recent 5% mild pullback took... pic.twitter.com/Igl0Wk6HCi
The current drawdown for the broad-based index took 35 trading days (seven weeks) to reach 5%. No bear market over 76 years has taken longer than 24 trading days to lose its initial 5%.
Emotional trading often results in stocks taking the stairs on the way up and the elevator on the way down. In other words, even though the Dow Jones Industrial Average, S&P 500, and Nasdaq Composite rise over extended periods, emotional trading can lead to jaw-dropping short-term declines during corrections and bear markets.
Based solely on historical precedent, the S&P 500's pullback is unlikely to become a full-fledged bear market.
Should you buy stock in S&P 500 Index right now?
Before you buy stock in S&P 500 Index, consider this:
The Motley Fool Stock Advisor analyst team just identified what they believe are the 10 best stocks for investors to buy now… and S&P 500 Index wasn’t one of them. The 10 stocks that made the cut could produce monster returns in the coming years.
Consider when Netflix made this list on December 17, 2004... if you invested $1,000 at the time of our recommendation, you’d have $533,522!* Or when Nvidia made this list on April 15, 2005... if you invested $1,000 at the time of our recommendation, you’d have $1,089,028!*
Now, it’s worth noting Stock Advisor’s total average return is 930% — a market-crushing outperformance compared to 185% for the S&P 500. Don't miss the latest top 10 list, available with Stock Advisor, and join an investing community built by individual investors for individual investors.
See the 10 stocks »
*Stock Advisor returns as of April 8, 2026.
Sean Williams has no position in any of the stocks mentioned. The Motley Fool has no position in any of the stocks mentioned. The Motley Fool has a disclosure policy.
Recommended Articles


