

Zcash Price Forecast: ZEC tests breakout rally after five-month decline

Source Fxstreet
  • Zcash extends gains on Tuesday to test an upside breakout of a resistance trendline, which could reverse the prevailing five-month decline.
  • Open Interest has increased by double-digits in 24 hours, signaling a surge in demand for the privacy coin.
  • The technical outlook is mildly bullish as the focus shifts to the overhead cluster of the 100-day and 200-day EMAs.

Zcash (ZEC) is up 4% at press time on Tuesday, attempting to break above a resistance trendline and reverse the prevailing five-month decline. A double-digit surge in ZEC futures Open Interest (OI) in the last 24 hours signals renewed retail strength for the privacy coin. 

Zcash derivatives market heats up

Zcash is gaining retail momentum amid broader market volatility ahead of the looming US-Iran deadline. CoinGlass data shows ZEC futures Open Interest (OI) is at $494.77 million, up over 10% in the last 24 hours, indicating a risk-on sentiment among retail traders that is driving a positional buildup. 

Total liquidations over the same period amount to $1.59 million, led by $1.11 million in short liquidations. Additionally, the 24-hour long-to-short ratio is 1.0751, suggesting that long positions outnumber short positions, consistent with buy-side dominance. 
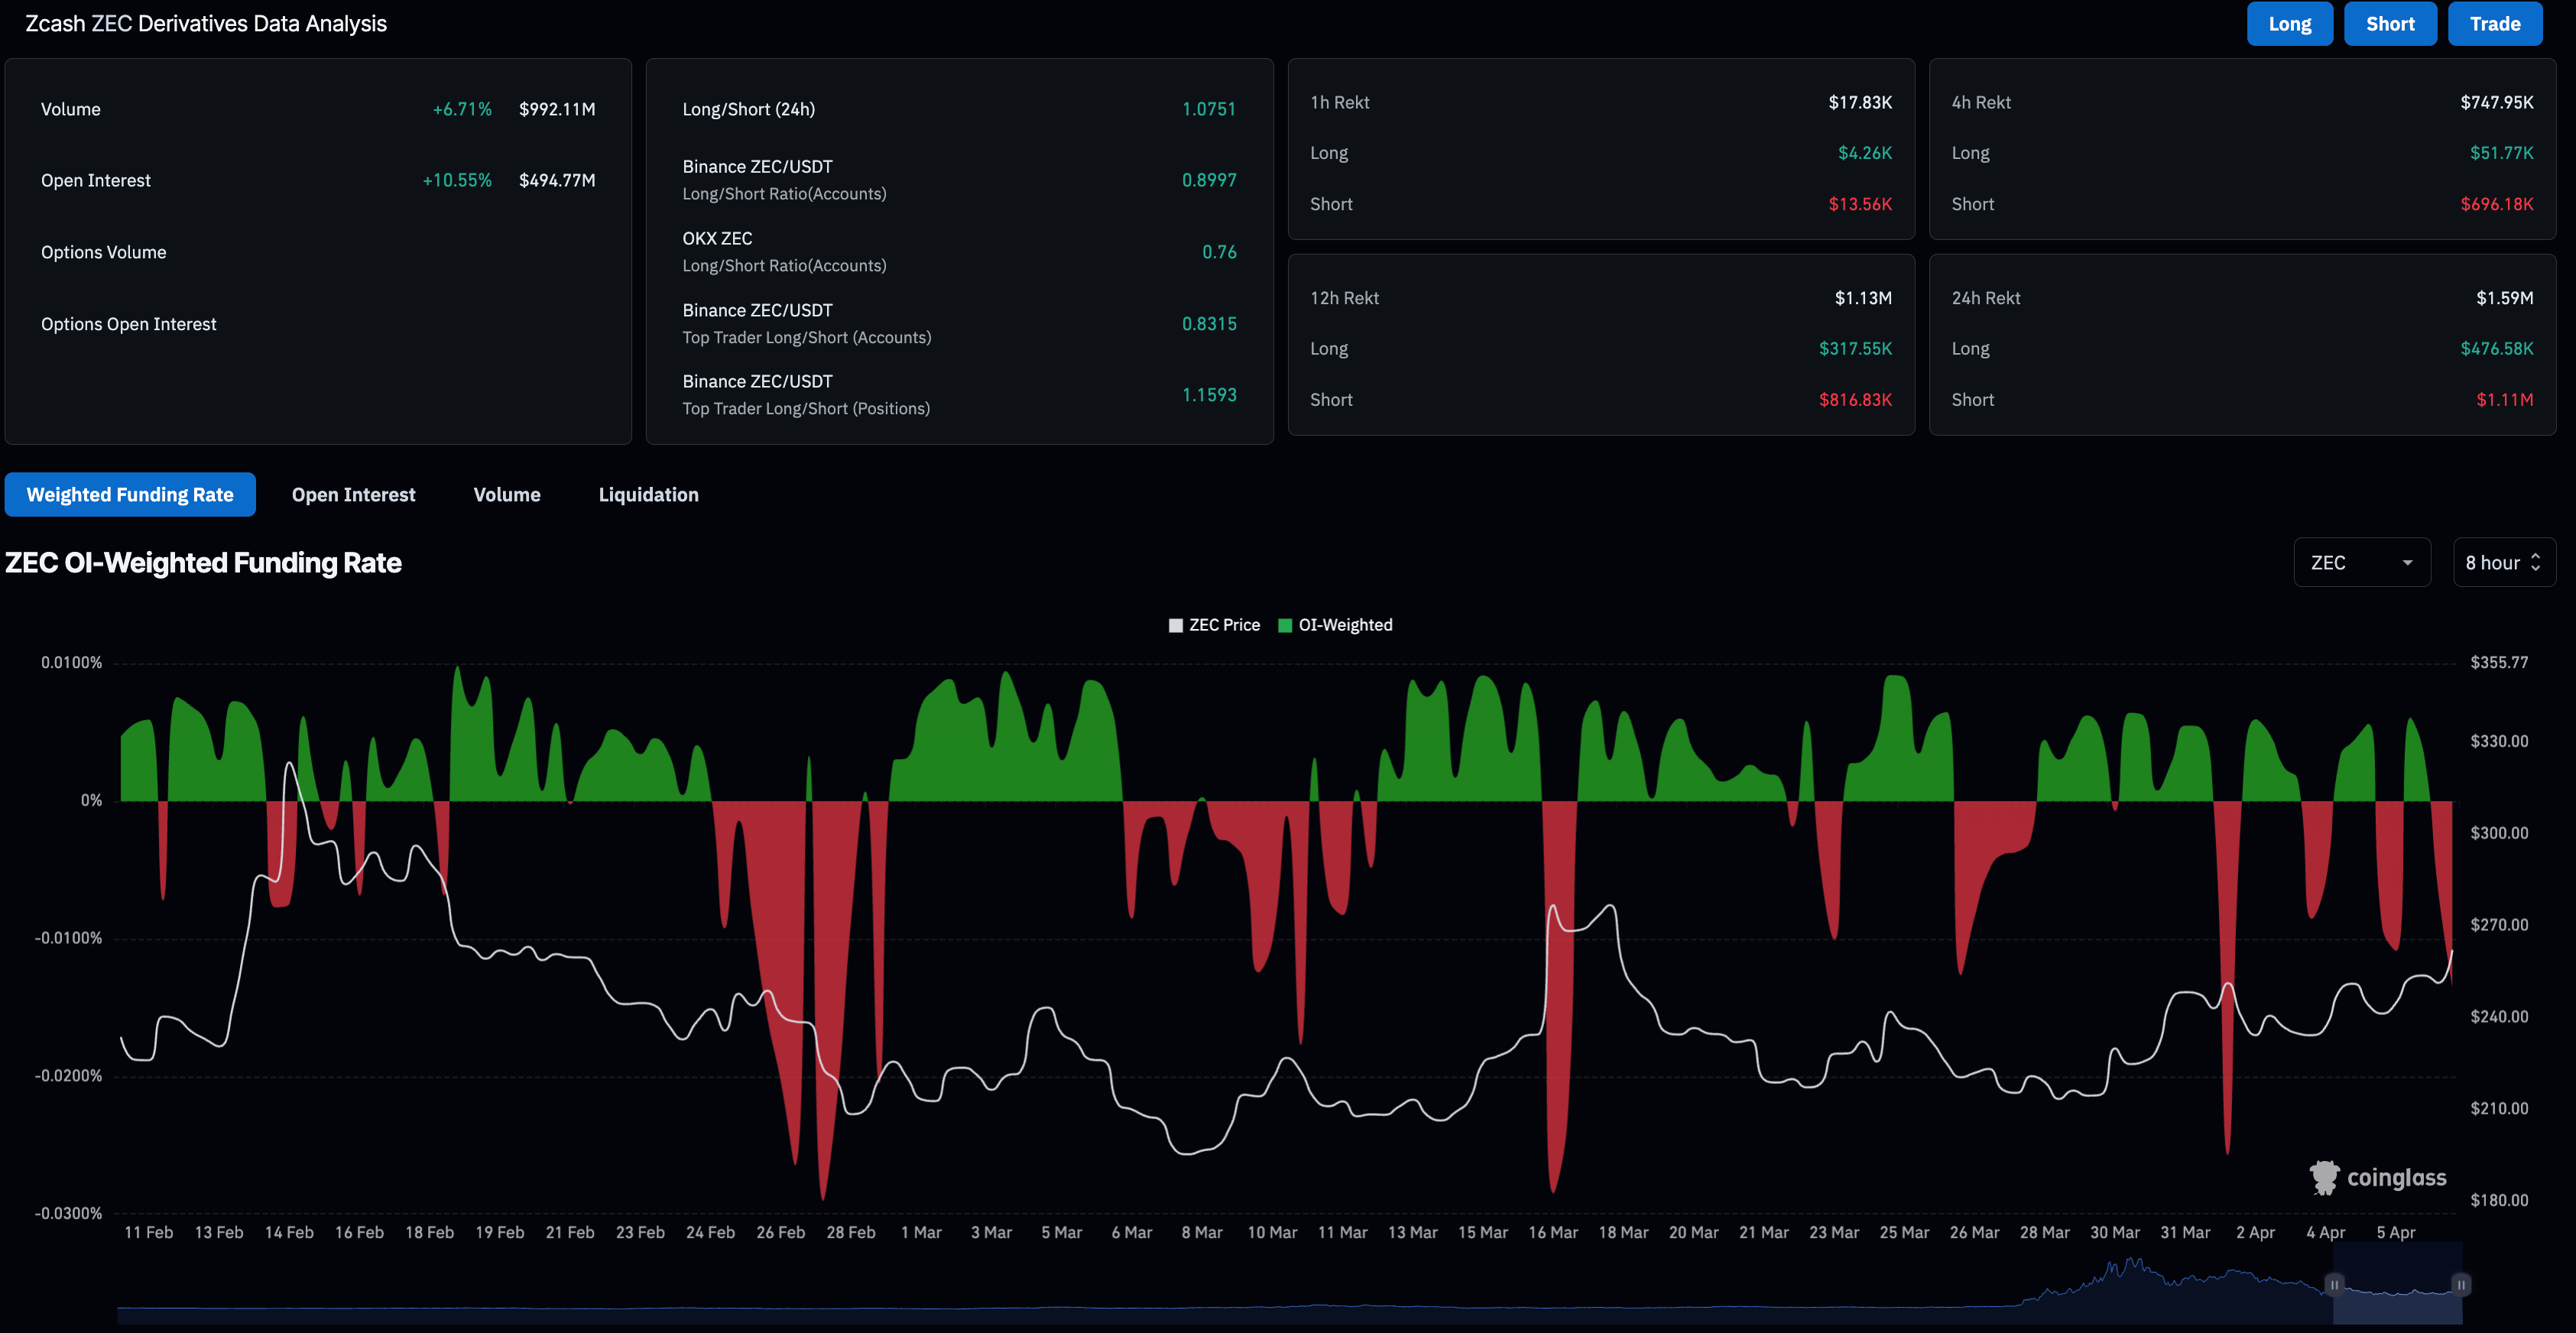
ZEC derivatives data. Source: CoinGlass

On the network side, adoption of Zcash for privacy via shielded ZEC tokens has plateaued. According to Zkp.baby, shielded ZEC tokens account for 31.13% of the total supply, and a surge in adoption could drive spot prices higher.
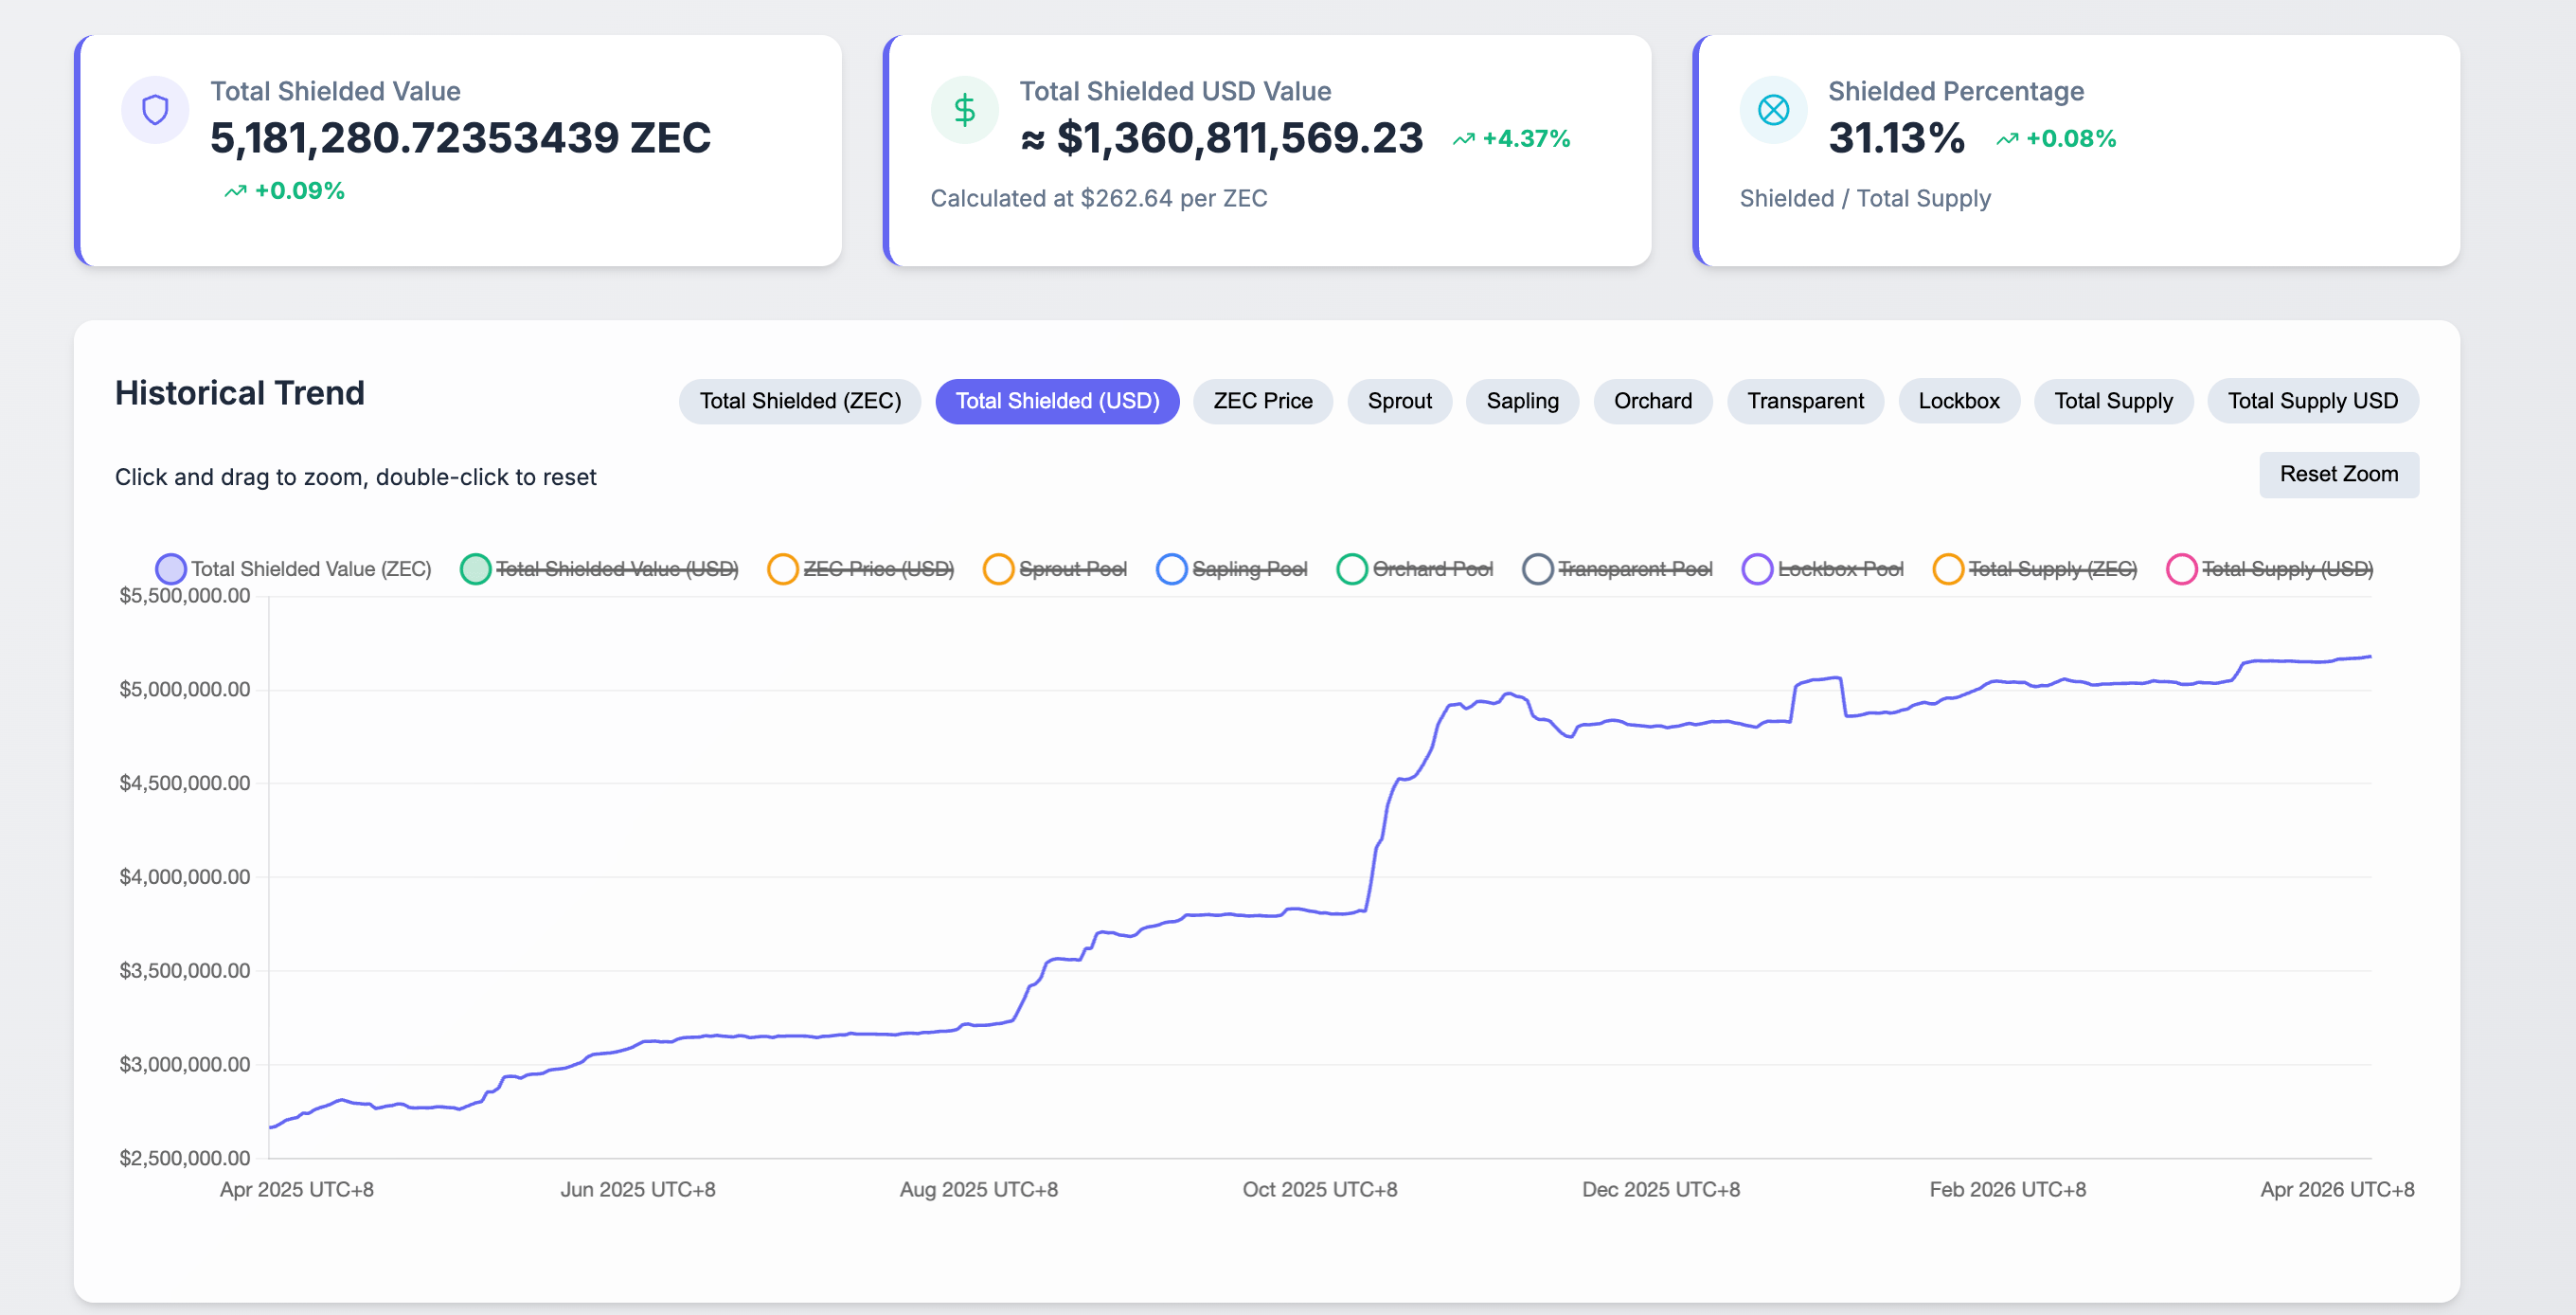
Zcash shielded tokens data. Source: Zkp.baby

Will Zcash recovery lead to a breakout rally?

Zcash extends gains above the $250 psychological level and the 50-day Exponential Moving Average (EMA) at $248 at press time on Tuesday. Still, ZEC trades beneath the 100- and 200-day EMAs, signaling an emerging recovery within a broader corrective context.

The near-term bias tilts mildly bullish as the privacy coin tests a descending resistance trendline near $260. A daily close above this level would expose the 100-day and 200-day EMA clustered at $273 and $276, respectively. If ZEC surpasses these dynamic resistances, it could test the February 14 high at $333 and expose higher levels.

The Moving Average Convergence Divergence (MACD) holds above its signal line and the zero mark on the daily chart, with expanding positive histogram bars, suggesting strengthening upside momentum. Meanwhile, the Relative Strength Index (RSI) at 59 shows firm but not overbought bullish pressure.

Chart Analysis ZEC/USDT (Binance)
ZEC/USDT daily price chart.

Looking down, the key support for ZEC lies at the 50-day EMA at $248, followed by the support trendline at $202.

(The technical analysis of this story was written with the help of an AI tool.)

Disclaimer: For information purposes only. Past performance is not indicative of future results.
placeholder
Bitcoin squeezes back above $80,000 — 110,000 traders liquidated as the hawkish Fed and CLARITY setback fail to hold it down; is $83,000 next?Bitcoin closed above $80,000 on Friday for the first time since September 7, and pushed to $81,299 over the weekend, triggering about $603 million of liquidations — $523 million of them shorts — across more than 110,000 traders. With the Fed's hike already priced and the SEC and CFTC advancing crypto rules after the CLARITY Act failed, here is what stands between BTC and the $83,000 gate.
Author  Suzie
13 hours ago
Bitcoin closed above $80,000 on Friday for the first time since September 7, and pushed to $81,299 over the weekend, triggering about $603 million of liquidations — $523 million of them shorts — across more than 110,000 traders. With the Fed's hike already priced and the SEC and CFTC advancing crypto rules after the CLARITY Act failed, here is what stands between BTC and the $83,000 gate.
placeholder
Gold ends three-week slide at the $4,400 line — eight straight days of ETF inflows vs a 5% 10-year and a 100 dollarSpot gold closed Friday at $4,378.39, up 0.84% on the day and about 0.8% for the week — its first weekly gain in four weeks — with the intraday high of $4,399.67 leaving it 33 cents shy of the $4,400 line. Gold ETFs have now logged eight straight sessions of inflows, but with the 10-year back above 5% and the dollar index near 100, here is what decides whether this is a reversal or a bounce.
Author  Suzie
13 hours ago
Spot gold closed Friday at $4,378.39, up 0.84% on the day and about 0.8% for the week — its first weekly gain in four weeks — with the intraday high of $4,399.67 leaving it 33 cents shy of the $4,400 line. Gold ETFs have now logged eight straight sessions of inflows, but with the 10-year back above 5% and the dollar index near 100, here is what decides whether this is a reversal or a bounce.
placeholder
Have Fed Rate Hike Headwinds Been Priced In? Gold Rebounds Strongly Toward $4,400, Poised for a New Rally As of the European session on September 18, gold prices (XAUUSD) extended Thursday's rebound, rising strongly in intraday trading to $4,399.75 today, just shy of the $4,400 psychological
Author  TradingKey
Sep 18, Fri
As of the European session on September 18, gold prices (XAUUSD) extended Thursday's rebound, rising strongly in intraday trading to $4,399.75 today, just shy of the $4,400 psychological
placeholder
US to delay new "overcapacity" tariffs on China — what the pause means for trade, inflation and the dollarWashington is expected to hold off announcing new tariffs over Chinese "overcapacity" until after the 24 September summit, according to Bloomberg. The postponed plan would have added 7.5% to Chinese goods, taking second-term US tariffs to around 20%. Here is what is on the table, and what a deal versus no deal would mean for the yuan, Hong Kong equities and the dollar.
Author  Mitrade
Sep 18, Fri
Washington is expected to hold off announcing new tariffs over Chinese "overcapacity" until after the 24 September summit, according to Bloomberg. The postponed plan would have added 7.5% to Chinese goods, taking second-term US tariffs to around 20%. Here is what is on the table, and what a deal versus no deal would mean for the yuan, Hong Kong equities and the dollar.
placeholder
Gold rebounds to near $4,350 on weaker US Dollar, falling oil pricesGold price (XAU/USD) rises to near $4,345 during the early Asian session on Friday. The precious metal rebounds from a six-week low amid falling oil prices and a weaker US Dollar (USD). Traders continue to assess the latest Federal Reserve (Fed) rate hike and policy cues.
Author  FXStreet
Sep 18, Fri
Gold price (XAU/USD) rises to near $4,345 during the early Asian session on Friday. The precious metal rebounds from a six-week low amid falling oil prices and a weaker US Dollar (USD). Traders continue to assess the latest Federal Reserve (Fed) rate hike and policy cues.
goTop
quote