


Bitcoin Price Forecast: BTC eyes breakout as US-Iran ceasefire boosts risk sentiment
- Bitcoin price nears the upper boundary of a consolidating channel on Wednesday, where a breakout would signal a bullish move ahead.
- Risk-on sentiment improves following a two-week ceasefire between the US and Iran, supporting risky assets.
- A report highlights that the current conditions mirror both past bullish and bearish setups, with broader trends pointing to a slow, low-volatility consolidation phase.
Bitcoin (BTC) is approaching the upper boundary of the horizontal channel that has been limiting the price since early February, trading near $71,800 on Wednesday, and a breakout of this zone would suggest an upside move. Easing geopolitical tensions between the US and Iran following the announcement of a two-week ceasefire supports a bullish narrative for the Crypto King, hinting at a potential breakout ahead.
US-Iran ceasefire boosts risk appetite
Bitcoin price rose more than 4% on Tuesday, closing at $71,924. This price surge followed the US and Iran’s brokered a two-week ceasefire and agreed to enter negotiations on Friday, potentially paving the way for lasting peace in the Middle East.
This news came in ahead of the US President Donald Trump’s deadline, warning of potential strikes on Iran’s civilian infrastructure – including power plants and bridges – if the Strait of Hormuz is not reopened by Tuesday at 8:00 PM Eastern Time (00:00 GMT on Wednesday).
In addition, Israeli Prime Minister Benjamin Netanyahu said during Asian trading hours on Wednesday that the nation supports President Trump’s decision to suspend attacks on Iran for two weeks, subject to Iran opening the Strait of Hormuz and stopping attacks, Israeli media reported.
These developments in the prolonged Middle East war boosts market risk appetite, with US equity futures surging on Wednesday, while crude Oil prices fall sharply. Meanwhile, the broader crypto market sentiment also improves, supporting gains in risk-sensitive assets.
Mixed sentiment across institutional demand
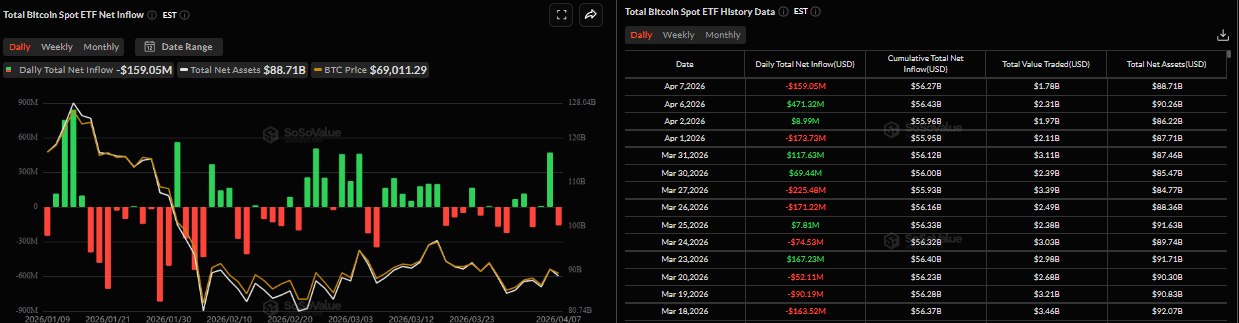
Institutional demand remains mixed so far this week. SoSoValue data shows that spot Bitcoin Exchange Traded Funds (ETFs) recorded an outflow of $159.05 million on Tuesday after an inflow of $471.32 million on Monday. Since the US-Iran ceasefire was announced during the early Asian session – when US markets were closed – spot Bitcoin ETFs could see positive inflows once Wall Street opens later in the day, potentially providing further support to the ongoing Bitcoin recovery.
No clear direction for Bitcoin
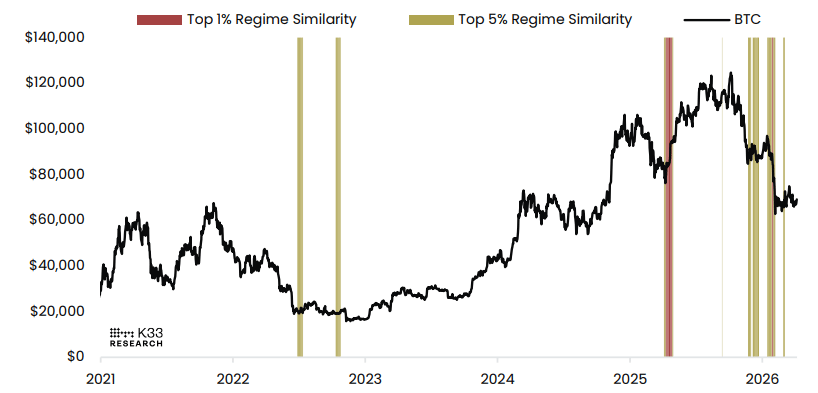
A K33 Research report on Tuesday stated that Bitcoin has consolidated between $60,000 and $75,000 for two months amid low volumes and defensive positioning, with mixed signals across technical, structural, and macro indicators, leaving the outlook unclear.
The graph below shows that the market structure most closely resembling the current regime is found in early April 2025, when BTC bottomed amid the height of Trump’s tariff push. The second-closest match occurred in late January 2026, just before BTC broke below $75,000.
“With the two closest matches leading to opposite outcomes, the current regime assessment offers inconclusive evidence on BTC’s path ahead,” said the K33 analyst.
The analyst continued, “Recent regimes naturally resemble the current one more closely, as regime similarities tend to persist for extended periods. Looking at the top 5% of regime matches outside of 2026, the closest resemblance is found in the slow, grinding bear market consolidation between July and September 2022.”
Bitcoin Price Forecast: BTC could extend its rally if it breaks above the channel top
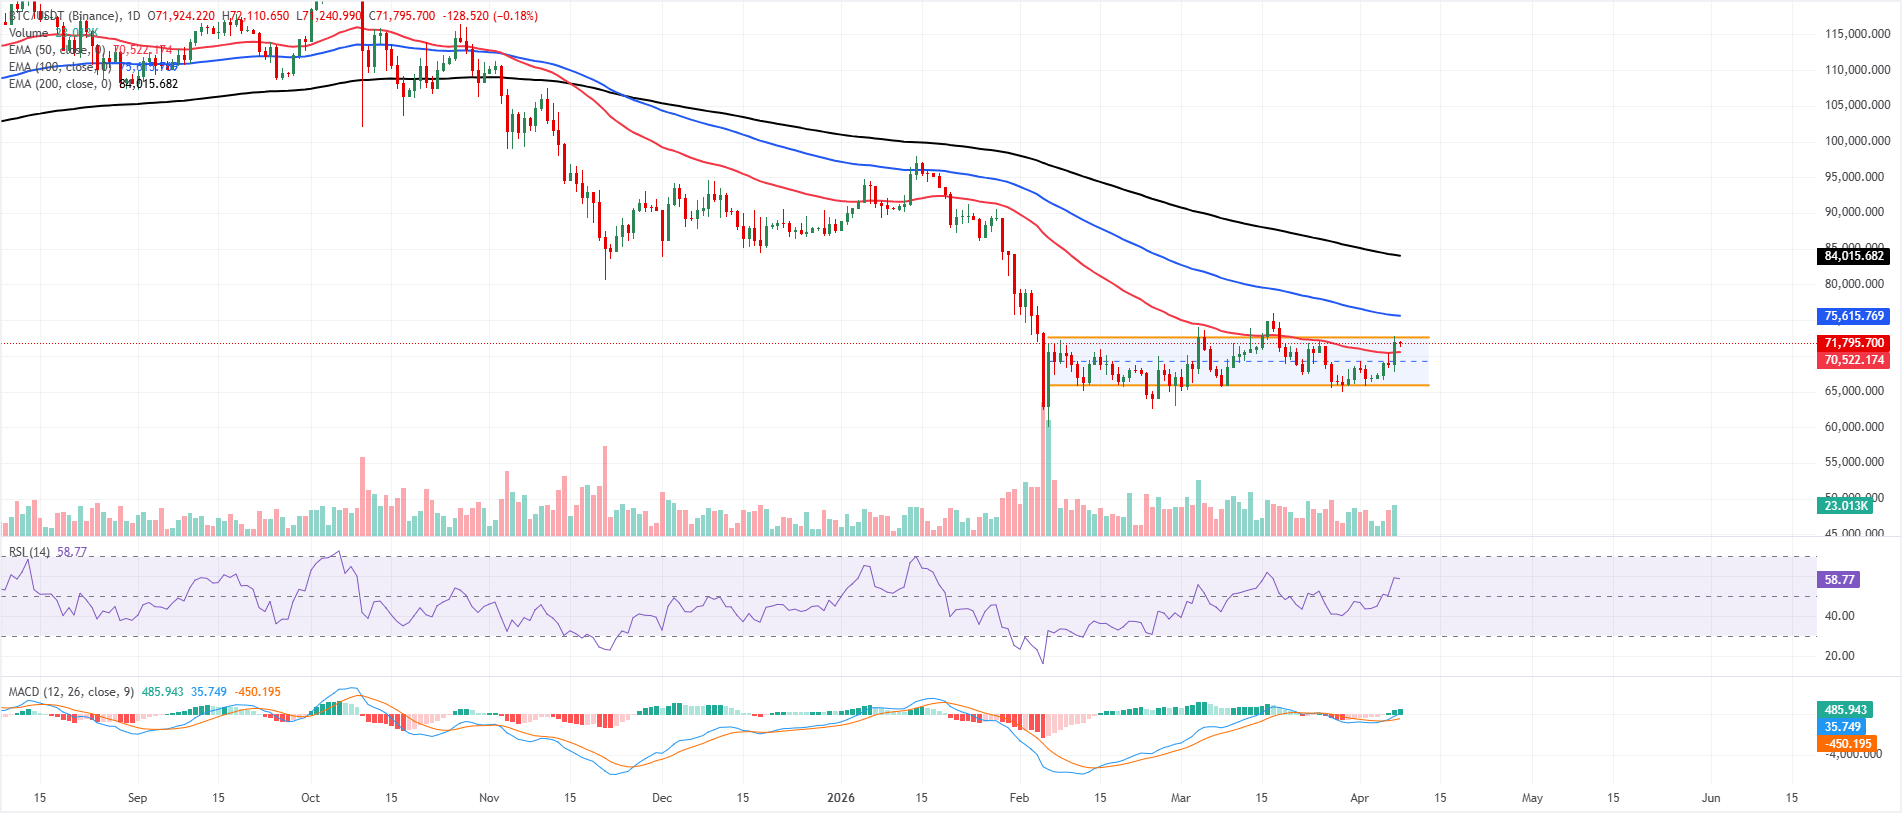
Bitcoin price is trading near $71,800 on Wednesday, after gaining over 4% the previous day. The near-term tone remains mildly bullish within a broader parallel channel, as price hovers just below the upper boundary near $72,600 while holding well above the 50-day Exponential Moving Average around $70,500. The cluster of medium- and long-term EMAs (100-day and 200-day) is well above price, underlining an intact broader downtrend despite the consolidating channel.
Momentum readings back a positive bias, with the Relative Strength Index (RSI) on the daily chart near 59 and the Moving Average Convergence Divergence (MACD) line extending above its signal line, while the widening positive histogram signals strengthening upside pressure.
Immediate resistance lies at the channel top near $72,600, and a daily close above this barrier would open the way to the 100-day EMA at $75,615. Above that, the psychological $76,000 area emerges as the next upside objective.
On the downside, initial support sits at the 50-day EMA near $70,500, followed by the channel midpoint at $69,300. A deeper pullback would expose the lower boundary of the parallel channel around $65,900, where buyers would be expected to defend the broader consolidating structure.
(The technical analysis of this story was written with the help of an AI tool.)
Bitcoin, altcoins, stablecoins FAQs
Bitcoin is the largest cryptocurrency by market capitalization, a virtual currency designed to serve as money. This form of payment cannot be controlled by any one person, group, or entity, which eliminates the need for third-party participation during financial transactions.
Altcoins are any cryptocurrency apart from Bitcoin, but some also regard Ethereum as a non-altcoin because it is from these two cryptocurrencies that forking happens. If this is true, then Litecoin is the first altcoin, forked from the Bitcoin protocol and, therefore, an “improved” version of it.
Stablecoins are cryptocurrencies designed to have a stable price, with their value backed by a reserve of the asset it represents. To achieve this, the value of any one stablecoin is pegged to a commodity or financial instrument, such as the US Dollar (USD), with its supply regulated by an algorithm or demand. The main goal of stablecoins is to provide an on/off-ramp for investors willing to trade and invest in cryptocurrencies. Stablecoins also allow investors to store value since cryptocurrencies, in general, are subject to volatility.
Bitcoin dominance is the ratio of Bitcoin's market capitalization to the total market capitalization of all cryptocurrencies combined. It provides a clear picture of Bitcoin’s interest among investors. A high BTC dominance typically happens before and during a bull run, in which investors resort to investing in relatively stable and high market capitalization cryptocurrency like Bitcoin. A drop in BTC dominance usually means that investors are moving their capital and/or profits to altcoins in a quest for higher returns, which usually triggers an explosion of altcoin rallies.
Recommended Articles


