
US S&P Global PMIs Preview: Economic expansion set to persist in May
- S&P Global PMIs are expected to indicate some loss of momentum in US economic activity in May.
- Manufacturing and Services prints are seen almost unchanged this month.
- EUR/USD remains on the back foot so far this week.
On Thursday, S&P Global will issue its flash estimates of the United States (US) Purchasing Managers Indexes (PMIs), a monthly survey of business activity. The survey is separated into services and manufacturing output and aggregated into a single statistic, the Composite PMI.
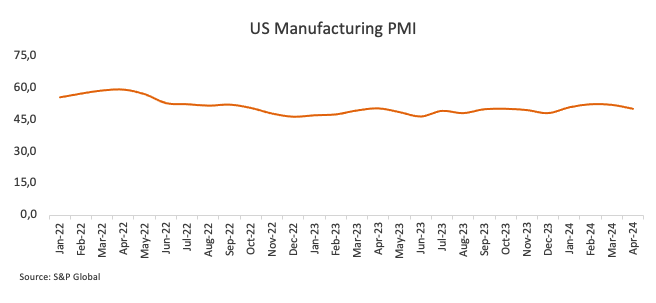
In April, economic activity in the US private sector contracted somewhat, with the S&P Global Composite PMI easing to 51.3, following a drop in manufacturing output to 50, while the services index slipped back to 51.3. All components, however, remained above the 50 threshold, the border between expansion and contraction.
From the press release: “Manufacturing production increased for the third consecutive month, albeit at the slowest pace in this sequence. With new orders down, output was often supported by work on previously received orders.”
With the US economy showing tepid signs of deceleration and the labour market cooling somewhat, market participants have been pencilling in the likelihood that the US Federal Reserve (Fed) might start reducing its Fed Funds Target Range (FFTR) in the next few months. However, sticky inflation continues to prompt caution regarding the potential timing of the commencement of the Fed’s easing programme, a view that has been further propped up by the equally prudent stance of many policymakers.
What can we expect from the next S&P Global PMI report?
The May S&P Global Manufacturing PMI is expected to be 50.0, unchanged from April’s figure, but still within the expansionary territory (>50). A similar outcome is forecast in terms of services production, with the index expected to print at 51.3, matching the previous month’s reading.
As long as the measurements are over 50.0, the impact of a decline should be minimal. However, a drop below the line that divides expansion and contraction might reinforce speculation about Fed rate reductions, most likely to begin at the September 18 meeting. Such a scenario could likely maintain the US Dollar (USD) under pressure, forcing the USD Index (DXY) to give away part of the weekly advance.
The opposite scenario, that is, a positive surprise, should underpin the Fed’s tighter-for-longer narrative, supporting a stronger Dollar and higher yields across the curve.
When will May flash US S&P Global PMIs be released and how could they affect EUR/USD?
The S&P Global PMI report will be issued on Thursday, May 23, at 13:45 GMT. So far, EUR/USD has been suffering the recovery in the Greenback and revisited the low-1.0800s after hitting fresh monthly peaks in levels just shy of 1.0900 the figure earlier in the month.
From the technical viewpoint, FXStreet’s Senior Analyst Pablo Piovano argues: “EUR/USD faces its initial up-barrier at the May peak of 1.0894 (May 6). The surpass of this region could prompt spot to embark on a potential visit to the March high of 1.0981 (March 8) seconded by the weekly top of 1.0998 (January 5, 2011), all followed by the psychological 1.1000 yardstick.”
Pablo adds: “On the downside, a sustainable breach of the key 200-day SMA at 1.0787 should shift the near-term outlook to bearish, allowing extra weakness to potentially retest the May low of 1.0649 (May 1) ahead of the 2024 bottom of 1.0601 (April 16).”
Economic Indicator
S&P Global Manufacturing PMI
The S&P Global Manufacturing Purchasing Managers Index (PMI), released on a monthly basis, is a leading indicator gauging business activity in the US manufacturing sector. The data is derived from surveys of senior executives at private-sector companies from the manufacturing sector. Survey responses reflect the change, if any, in the current month compared to the previous month and can anticipate changing trends in official data series such as Gross Domestic Product (GDP), industrial production, employment and inflation. A reading above 50 indicates that the manufacturing economy is generally expanding, a bullish sign for the US Dollar (USD). Meanwhile, a reading below 50 signals that activity in the manufacturing sector is generally declining, which is seen as bearish for USD.
Read more.Next release: Thu May 23, 2024 13:45 (Prel)
Frequency: Monthly
Consensus: 50
Previous: 50
Source: S&P Global
GDP FAQs
A country’s Gross Domestic Product (GDP) measures the rate of growth of its economy over a given period of time, usually a quarter. The most reliable figures are those that compare GDP to the previous quarter e.g Q2 of 2023 vs Q1 of 2023, or to the same period in the previous year, e.g Q2 of 2023 vs Q2 of 2022. Annualized quarterly GDP figures extrapolate the growth rate of the quarter as if it were constant for the rest of the year. These can be misleading, however, if temporary shocks impact growth in one quarter but are unlikely to last all year – such as happened in the first quarter of 2020 at the outbreak of the covid pandemic, when growth plummeted.
A higher GDP result is generally positive for a nation’s currency as it reflects a growing economy, which is more likely to produce goods and services that can be exported, as well as attracting higher foreign investment. By the same token, when GDP falls it is usually negative for the currency. When an economy grows people tend to spend more, which leads to inflation. The country’s central bank then has to put up interest rates to combat the inflation with the side effect of attracting more capital inflows from global investors, thus helping the local currency appreciate.
When an economy grows and GDP is rising, people tend to spend more which leads to inflation. The country’s central bank then has to put up interest rates to combat the inflation. Higher interest rates are negative for Gold because they increase the opportunity-cost of holding Gold versus placing the money in a cash deposit account. Therefore, a higher GDP growth rate is usually a bearish factor for Gold price.
Recommended Articles


