Silver Price Forecast: XAG/USD holds key support of $29 as cooler US CPI boosts Fed rate-cut bets

Source Fxstreet
  • Silver price gains ground above $29.00 as soft US price pressures weigh on bond yields.
  • Traders price in two rate cuts this year against one signaled by the Fed.
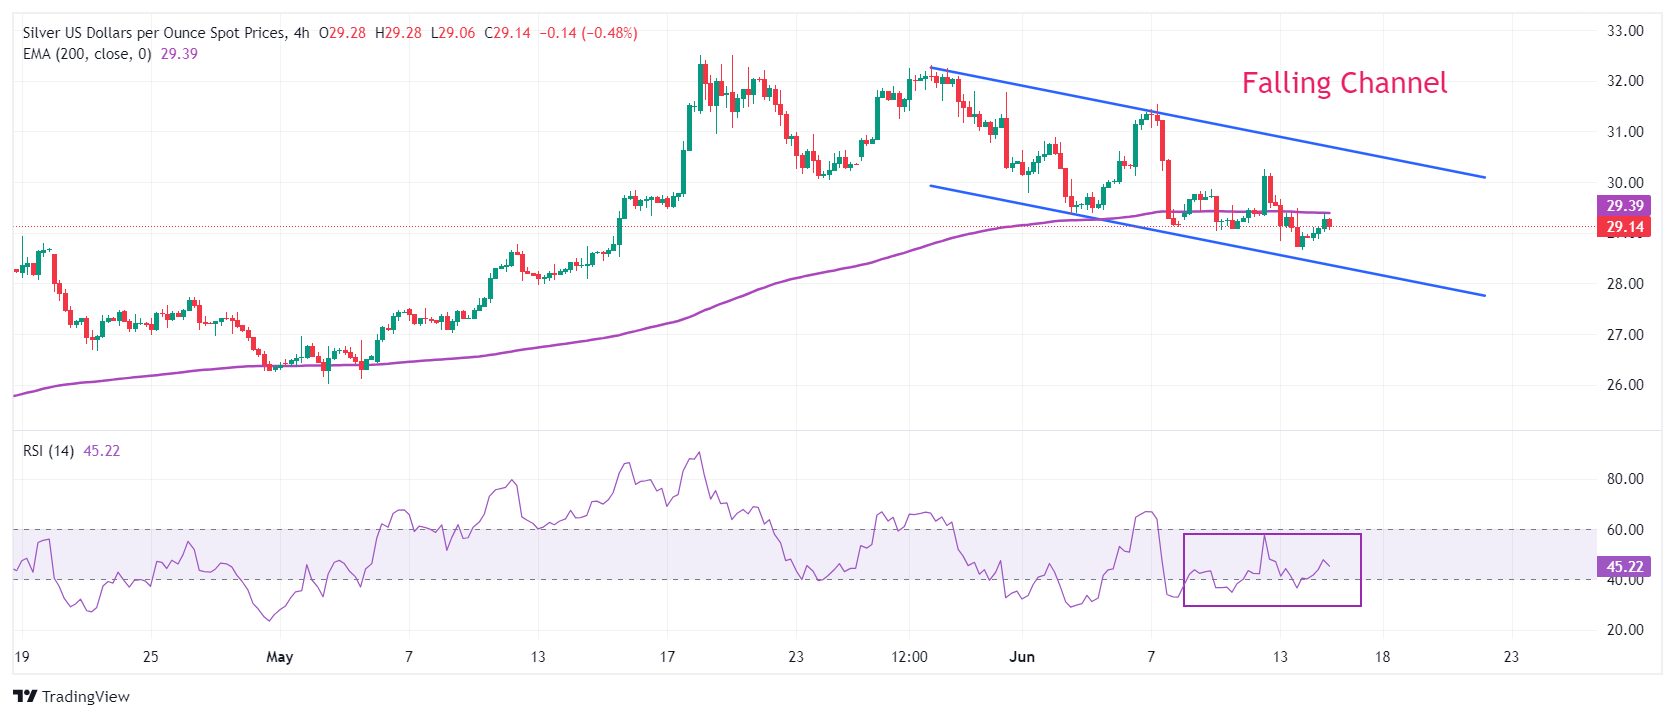
  • Silver price trades in a Falling Channel formation.

Silver price (XAG/USD) clings to key support of $29.00 in Friday’s American session. The white metal rebounds as US bond yields come under pressure due to improved speculation that the Federal Reserve (Fed) will start reducing interest rates from the September meeting.

10-year US Treasury yields have dropped to near 4.20%. Lower yields on interest-bearish assets reduce the opportunity cost of holding an investment in non-yielding assets, such as Silver.

The CME FedWatch tool shows that the probability for rate cuts in September has improved to almost 71% from 50.4% recorded a week ago. Market expectations for Fed rate cuts have risen as the United States (US) consumer and produce inflation decline on monthly and an annual basis in May. Major contribution to decline in price pressures came from soft gasoline prices.

The CME FedWatch Tool also shows that there will be two rate cuts this year against one signalled by Fed policymakers in their latest dot plot. Fed officials lowered potential number of rate cuts in the forecast report from three forecasted in March as they were concerned over inflation remaining stubborn due to strong labor market conditions.

Meanwhile, the US Dollar Index (DXY), which tracks the Greenback’s value against six major currencies, jumps to 105.70.

Silver technical analysis

Silver price trades inside Thursday’s trading range. The white metal trades in a Falling Channel chart pattern in which each pullback is considered as selling opportunity by market participants. The asset has dropped below the 200-period Exponential Moving Average (EMA), which trades around $29.40, indicating the overall trend has turned bearish.

The 14-period Relative Strength Index (RSI) oscillates in the 40.00-60.00 range, suggesting a consolidating ahead.

Silver four-hour chart
XAG/USD

Overview
Today last price 29.16
Today Daily Change 0.20
Today Daily Change % 0.69
Today daily open 28.96
 
Trends
Daily SMA20 30.62
Daily SMA50 28.93
Daily SMA100 26.34
Daily SMA200 24.75
 
Levels
Previous Daily High 29.73
Previous Daily Low 28.66
Previous Weekly High 31.55
Previous Weekly Low 29.12
Previous Monthly High 32.51
Previous Monthly Low 26.02
Daily Fibonacci 38.2% 29.07
Daily Fibonacci 61.8% 29.32
Daily Pivot Point S1 28.5
Daily Pivot Point S2 28.04
Daily Pivot Point S3 27.43
Daily Pivot Point R1 29.58
Daily Pivot Point R2 30.19
Daily Pivot Point R3 30.66


Disclaimer: For information purposes only. Past performance is not indicative of future results.
placeholder
EURUSD Long-term Forecast: Can ECB Hawks Overcome the Dollar Bullishness? As one of the most traded currency pair in the forex markets, the price of EURUSD affects many traders. Check out our EURUSD long-term forecast for more information.
Author  Mitrade
Mar 13, 2023
As one of the most traded currency pair in the forex markets, the price of EURUSD affects many traders. Check out our EURUSD long-term forecast for more information.
placeholder
Copper Long-term forecast: Will Copper Price Expected To Soar In 2023?The price of copper is affected by various of factors. You may wonder how the price of cooper will be in 2023, check out our forecast analysis.
Author  Mitrade
Mar 13, 2023
The price of copper is affected by various of factors. You may wonder how the price of cooper will be in 2023, check out our forecast analysis.
placeholder
Bitcoin CME gaps at $35,000, $27,000 and $21,000, which one gets filled first?Prioritize filling the $27,000 gap and even try higher.
Author  FXStreet
Aug 21, 2023
Prioritize filling the $27,000 gap and even try higher.
placeholder
Natural Gas sinks to pivotal level as China’s demand slumpsNatural Gas price (XNG/USD) edges lower and sinks to $2.56 on Monday, extending its losing streak for the fifth day in a row. The move comes on the back of China cutting its Liquified Natural Gas (LNG) imports after prices rose above $3.0 in June. It
Author  FXStreet
Jul 01, Mon
Natural Gas price (XNG/USD) edges lower and sinks to $2.56 on Monday, extending its losing streak for the fifth day in a row. The move comes on the back of China cutting its Liquified Natural Gas (LNG) imports after prices rose above $3.0 in June. It
placeholder
Weekly Market Outlook: Tesla Kicks Off Big Tech Earnings; U.S. Election Enters Final StretchTradingKey – This week, key economic data includes U.S. September durable goods orders, the University of Michigan’s October Consumer Sentiment Index, and preliminary PMI data from several countries,
Author  Mitrade
22 hours ago
TradingKey – This week, key economic data includes U.S. September durable goods orders, the University of Michigan’s October Consumer Sentiment Index, and preliminary PMI data from several countries,
Related Instrument
goTop
quote