NZD/USD Price Analysis: Consolidation phase intensifies, bulls present battle

Source Fxstreet
  • The NZD/USD stabilizes near 20-day SMA as bears intensify their attempts to breach the20-day SMA.
  • Despite spirited defenses, both bulls and bears are yet to make significant headway.
  • Daily chart indicators underscore continued consolidation with a slight downward momentum.

The NZD/USD dipped to a low of 0.6115 before recovering and stabilizing at the 20-day Simple Moving Average (SMA) of 0.6140. Both bulls and bears seem locked in an intense tussle with attempts to breach the 0.6220 area and the 20-day SMA respectively proving unsuccessful. This is indicative of an ongoing consolidation phase in the aftermath of Mid-May's sharp increase which saw the pair rise by more than 1.30%.

In the daily chart, the Relative Strength Index (RSI) has switched momentum and is now pointing downwards, suggesting a slight decline in buying pressure. This downward shift in the RSI is consistent with the flat red bars in the Moving Average Convergence Divergence (MACD), which further corroborates the consolidation narrative.

NZD/USD daily chart

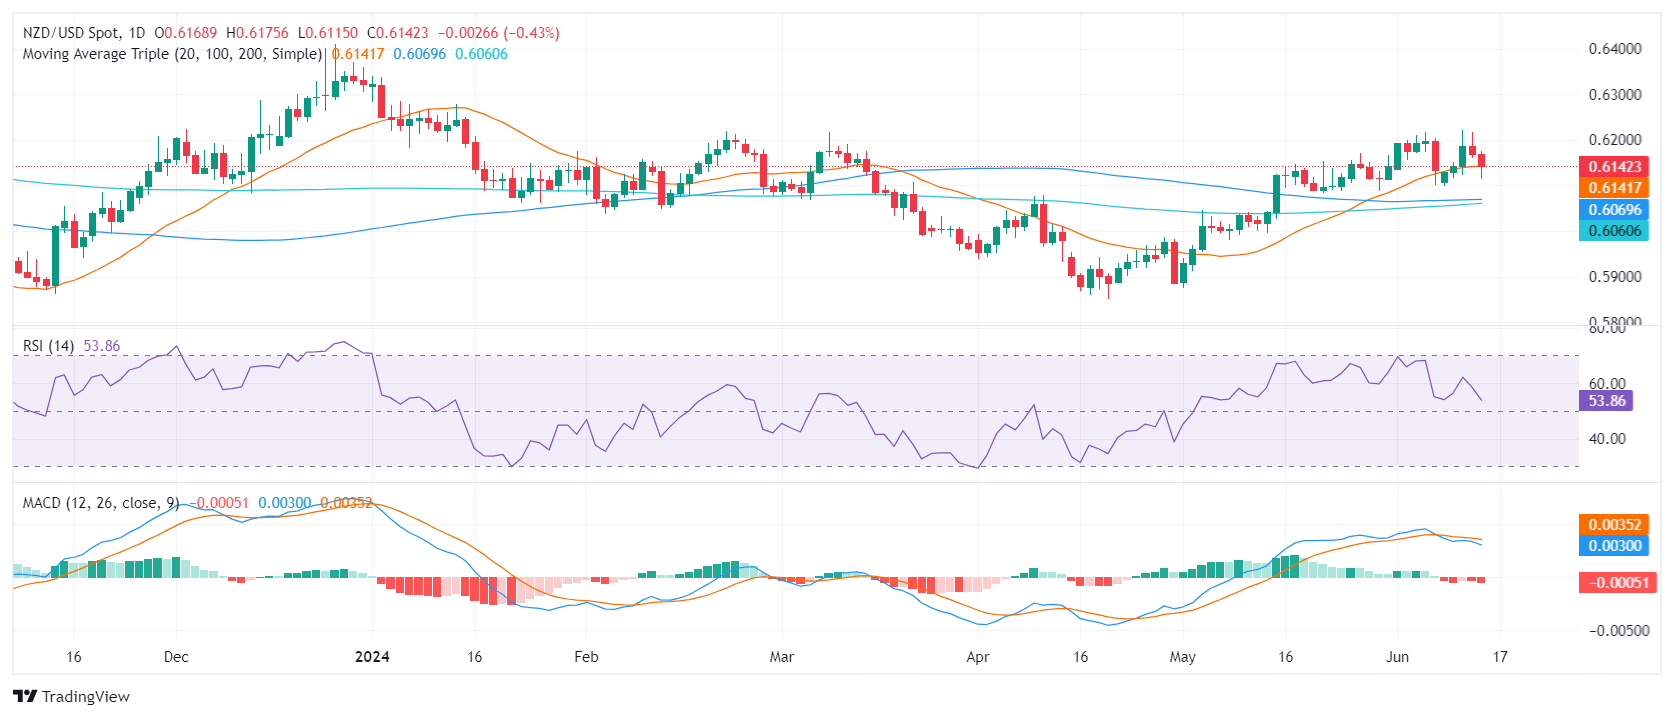
The NZD/USD's immediate support is now at the 20-day SMA of 0.6140, with the 100 and 200-day SMAs converging in the 0.6050-0.6060 region and providing a strong support base for the pair. This could potentially serve as an anchor for correction if bears begin to take control. Any movements below this point of convergence may potentially signal sell conditions.

On the upside, the 0.6200 is the main resistance which in case of being breached, could be considered a buy signal.


NZD/USD

Overview
Today last price 0.6142
Today Daily Change -0.0027
Today Daily Change % -0.44
Today daily open 0.6169
 
Trends
Daily SMA20 0.6141
Daily SMA50 0.6044
Daily SMA100 0.6069
Daily SMA200 0.6059
 
Levels
Previous Daily High 0.6218
Previous Daily Low 0.6159
Previous Weekly High 0.6216
Previous Weekly Low 0.6101
Previous Monthly High 0.6171
Previous Monthly Low 0.5875
Daily Fibonacci 38.2% 0.6181
Daily Fibonacci 61.8% 0.6195
Daily Pivot Point S1 0.6146
Daily Pivot Point S2 0.6123
Daily Pivot Point S3 0.6088
Daily Pivot Point R1 0.6205
Daily Pivot Point R2 0.624
Daily Pivot Point R3 0.6263


Disclaimer: For information purposes only. Past performance is not indicative of future results.
placeholder
Seesaw Effect Continues. US Pre-Market Three Major Index Futures Weaken, Oil Prices Rise, Bitcoin Drops Below 68,000 MarkAgainst a backdrop of intertwined geopolitical risks and macroeconomic uncertainty, global market sentiment has repeatedly diverged. In Friday pre-market trading ET, the three major U.S.
Author  TradingKey
Mar 27, Fri
Against a backdrop of intertwined geopolitical risks and macroeconomic uncertainty, global market sentiment has repeatedly diverged. In Friday pre-market trading ET, the three major U.S.
placeholder
Australian Dollar falls to two-month lows on US–Iran peace uncertaintyAUD/USD extends its losing streak for the fourth consecutive day, trading around 0.6880 during the Asian hours on Friday.
Author  FXStreet
Mar 27, Fri
AUD/USD extends its losing streak for the fourth consecutive day, trading around 0.6880 during the Asian hours on Friday.
placeholder
US-Iran Rift Persists, Will Gold Rise or Fall Next?US-Iran tensions persist; $4,400 becomes the gold ( XAUUSD) bulls' make-or-break level.During the European session on March 26, as of press time, spot gold retreated 1.5% to $4,436.42 per
Author  TradingKey
Mar 26, Thu
US-Iran tensions persist; $4,400 becomes the gold ( XAUUSD) bulls' make-or-break level.During the European session on March 26, as of press time, spot gold retreated 1.5% to $4,436.42 per
placeholder
Gold rallies on hopes for US-Iran talks and falling US Treasury yieldsGold price (XAU/USD) gains nearly 2% on Wednesday as Oil futures prices tumbled amid growing speculation that the US and Iran would begin talks to end the conflict that started nearly four weeks ago. At the time of writing, XAU/USD trades at $4,556.
Author  FXStreet
Mar 26, Thu
Gold price (XAU/USD) gains nearly 2% on Wednesday as Oil futures prices tumbled amid growing speculation that the US and Iran would begin talks to end the conflict that started nearly four weeks ago. At the time of writing, XAU/USD trades at $4,556.
placeholder
Gold Prices Under Pressure After Hitting $4,600, UBS: Safe-Haven Logic Unchanged But Only Delayed.Impacted by signs of easing geopolitical risks in the Middle East, international gold prices (XAUUSD) rebounded sharply after previously falling to the $4,100 level, at one point climbing
Author  TradingKey
Mar 25, Wed
Impacted by signs of easing geopolitical risks in the Middle East, international gold prices (XAUUSD) rebounded sharply after previously falling to the $4,100 level, at one point climbing
Related Instrument
goTop
quote