


Gold price surges over 1.3% as soft US inflation data fuels rate cut hopes
- Gold soars above $2,330 as investors bet on Fed rate cuts later this year.
- Risk aversion due to European political turmoil boosts demand for safe-haven assets like gold.
- US Consumer Sentiment dips in June, inflation expectations remain above Fed’s 2% target.
- XAU/USD is underpinned by fall of 10-year US Treasury yield.
Gold's price spiked during the North American session on Friday after inflation data in the United States (US) increased investors' hopes of the Federal Reserve (Fed) cutting interest rates later this year. Additionally, risk aversion, spurred by Europe’s political uncertainty, triggered a flight to safety, bolstering the golden metal.
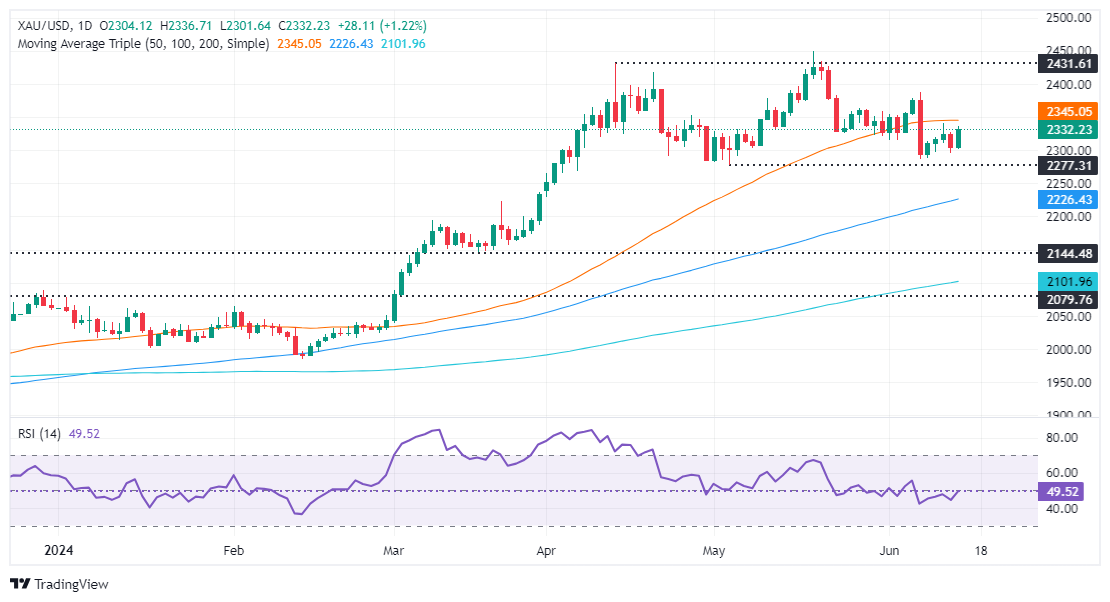
The XAU/USD trades at $2,333, gaining more than 1.30% after bouncing off daily lows of $2,301. Sentiment remains sour, yet US equities recovered some during the last hour of trading, with the Nasdaq up 0.28%, while the S&P 500 trims its earlier losses, shy of being flat on the day at -0.10%.
On the data front, US Consumer Sentiment deteriorated in June, while inflation expectations for one and five years remained above the Fed’s 2% goal. Meanwhile, US inflation data revealed during the week was cheered by investors, who still bet that the US central bank will slash rates twice instead of just once, as policymakers projected.
Data from the Chicago Board of Trade (CBOT) shows traders expect 39 basis points (bps) of easing during the year via December’s 2024 fed funds rate contract.
The US 10-year Treasury note yield dropped three bps to 4.211%, a tailwind for the non-yielding metal, shrugging off China’s bullion purchasing pause.
News that the People’s Bank of China paused its 18-month bullion buying spree weighed on the precious metal. PBOC holdings held steady at 72.80 million troy ounces of Gold in May.
Daily digest market movers: Gold price strengthens amid strong US Dollar
- US Dollar Index (DXY) increased by 0.28% to 105.53, capping Gold prices.
- University of Michigan Consumer Sentiment Index fell to 65.6 in June from 69.1, missing the consensus estimate of 72. This marks the lowest level of sentiment in seven months.
- Inflation expectations for the next twelve months are projected to remain unchanged at 3.3%; while for the five-year period, inflation expectations are anticipated to decrease to 3.1%, down from the previous 3.3%.
- On Wednesday, Fed Chair Jerome Powell stated that they are less confident about inflation than previously "in order to cut." He added, "If jobs are to weaken unexpectedly, the Fed is ready to respond." When asked about the US CPI report, Powell noted that it is just one report and emphasized the need to see the deflation process evolving toward the Fed’s goal.
- Despite US CPI report showing disinflation process continuing, Fed Chair Jerome Powell commented that they remain “less confident” about the progress on inflation.
- Even though the latest US CPI and PPI reports were weaker than expected, the latest NFIB Small Business Optimism Index survey for May showed that businesses are struggling with higher prices and access to cheap financing.
Technical analysis: Gold price sellers regain control as prices are headed toward $2,300
Gold price is neutral to downwardly biased as the Head-and-Shoulders chart pattern remains in place, suggesting the stage is set for further downside. Although momentum shows buyers’ recovery, the Relative Strength Index (RSI) remains bearish, suggesting that the uptrend could be short-lived and open the door for further losses.
If Gold extends its gains past the June 7 cycle high of $2,387, it will be ready to test the $2,400 figure. Conversely, if XAU/USD drops below $2,300, the first support would be the May 3 low of $2,277, followed by the March 21 high of $2,222. Further losses lie beneath, as sellers would eye the Head-and-Shoulders chart pattern objective at around $2,170 to $2,160.
Gold FAQs
Gold has played a key role in human’s history as it has been widely used as a store of value and medium of exchange. Currently, apart from its shine and usage for jewelry, the precious metal is widely seen as a safe-haven asset, meaning that it is considered a good investment during turbulent times. Gold is also widely seen as a hedge against inflation and against depreciating currencies as it doesn’t rely on any specific issuer or government.
Central banks are the biggest Gold holders. In their aim to support their currencies in turbulent times, central banks tend to diversify their reserves and buy Gold to improve the perceived strength of the economy and the currency. High Gold reserves can be a source of trust for a country’s solvency. Central banks added 1,136 tonnes of Gold worth around $70 billion to their reserves in 2022, according to data from the World Gold Council. This is the highest yearly purchase since records began. Central banks from emerging economies such as China, India and Turkey are quickly increasing their Gold reserves.
Gold has an inverse correlation with the US Dollar and US Treasuries, which are both major reserve and safe-haven assets. When the Dollar depreciates, Gold tends to rise, enabling investors and central banks to diversify their assets in turbulent times. Gold is also inversely correlated with risk assets. A rally in the stock market tends to weaken Gold price, while sell-offs in riskier markets tend to favor the precious metal.
The price can move due to a wide range of factors. Geopolitical instability or fears of a deep recession can quickly make Gold price escalate due to its safe-haven status. As a yield-less asset, Gold tends to rise with lower interest rates, while higher cost of money usually weighs down on the yellow metal. Still, most moves depend on how the US Dollar (USD) behaves as the asset is priced in dollars (XAU/USD). A strong Dollar tends to keep the price of Gold controlled, whereas a weaker Dollar is likely to push Gold prices up.
Recommended Articles


