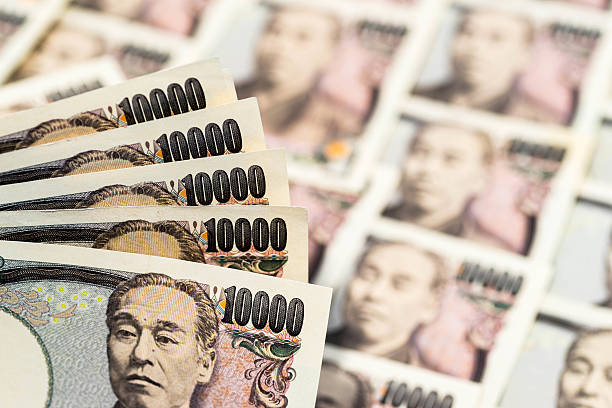
Japanese Yen stands tall near one-month top against USD on hawkish BoJ talks

Mitrade
coverImg
Source: DepositPhotos

■  The Japanese Yen continues to draw support from expectations for a hawkish BoJ pivot.

■  Bets for a June Fed rate cut undermine the USD and further exert pressure on USD/JPY.

■  An upward revision of Japan’s Q4 GDP print contributes to the offered tone on Monday.


The Japanese Yen (JPY) rallied to the highest level since early February against its American counterpart on Friday amid bets for an imminent shift in the Bank of Japan's (BoJ) policy stance. Moreover, investors seem convinced that another substantial pay hike in Japan will fuel demand-driven inflationary pressure and allow the BoJ to end the negative interest rates as early as the March 18-19 meeting. This, along with an upward revision of Japan's fourth-quarter GDP print, underpins the JPY and keeps the USD/JPY pair depressed through the Asian session on Monday.


Meanwhile, the US employment report for February reaffirmed expectations that the Federal Reserve (Fed) will start cutting interest rates in June and continues to weigh on the US Dollar (USD). This turns out to be another factor that contributes to the offered tone surrounding the USD/JPY pair for the sixth straight day and supports prospects for a further depreciating move. The market focus now shifts to the US consumer inflation figures, due for release on Tuesday. Nevertheless, the fundamental backdrop suggests that the path of least resistance for spot prices is to the downside.


Daily Digest Market Movers: Japanese Yen remains well supported by bets for an imminent shift in the BoJ’s policy stance


The Japanese Yen remains on the front foot against its American counterpart for the sixth successive day on Monday amid bets that the Bank of Japan (BoJ) will end its negative rate policy in March.


Jiji News Agency reported over the weekend that the BoJ is considering scrapping its yield curve control program and indicating in advance the amount of government bonds it plans to purchase.


Furthermore, data released last week showed that wage growth in Japan marked the highest rise since last June and reaffirmed market bets for an imminent shift in the BoJ's monetary policy stance.


A revised GDP report showed on Monday that Japan's economy expanded by 0.1% during the fourth quarter as against a 0.1% contraction reported previously and avoided a technical recession.


This gives the BoJ more headroom to pivot away from its ultra-loose monetary policy settings, which continue to underpin the JPY and keep the USD/JPY pair depressed near a one-month low.


A spike in the US unemployment rate to its highest level in two years lifted bets for a June rate cut by the Federal Reserve and dragged the US Dollar to its lowest level since mid-January on Friday.


The headline NFP showed that the US economy added 275K jobs in February vs. 200K estimated, through was offset by a downward revision of the previous month's reading to 229K from 353 K.


Investors now look forward to the release of the latest US consumer inflation figures on Tuesday for a fresh impetus, though the near-term bias seems tilted firmly in favour of the JPY bulls.


Technical Analysis: USD/JPY continues to show hows some resilience below 38.2% Fibo. level, remains vulnerable to sliding further


From a technical perspective, Friday's breakdown below the 100-day Simple Moving Average (SMA) was seen as a fresh trigger for bearish traders. This comes on top of the recent repeated failures ahead of the 152.00 mark, which constituted the formation of a double-top pattern on the daily chart. Moreover, oscillators on the said chart are holding deep in the negative territory and validate the bearish outlook for the USD/JPY pair. That said, it will still be prudent to wait for acceptance below the 38.2% Fibonacci retracement level of the December-February rally before positioning for further losses. Some follow-through selling below the 200-day SMA, currently pegged near the 146.30-146.25 region, will reaffirm the negative bias and drag spot prices below the 146.00 round figure, towards the 50% Fibo. level, around the 145.60 zone.


On the flip side, any meaningful recovery attempt beyond the 147.00 round figure is more likely to attract fresh sellers and remain capped near the 100-day SMA support breakpoint, now turned resistance near mid-147.00s. A sustained strength beyond, however, could trigger a short-covering rally and lift the USD/JPY pair beyond the 148.00 mark, towards testing the next relevant hurdle near the 148.65-148.70 region. The momentum could extend further towards reclaiming the 149.00 round figure en route to the 149.25 horizontal support-turned-resistance.

Read more

  • Gold Price Forecast: Why Did Gold Rebound After September PPI Rose by Most in Nearly Four Years?
  • Today’s Market Recap: U.S. Stocks Rebound, Dow Jumps Over 1%, Micron Gains 1.87%, CoreWeave Rallies Nearly 6%
  • * The content presented above, whether from a third party or not, is considered as general advice only.  This article should not be construed as containing investment advice, investment recommendations, an offer of or solicitation for any transactions in financial instruments.

    goTop
    quote
    Related Articles
    placeholder
    Brent slips from $110 as Russian supply prospects return — is the five-month rally over?Brent crude traded near $108.06 on Monday (-1.71%), pulling back from last week's $110 high after Washington moved to ease restrictions on Russian oil flows. WTI hovered around $101 before dipping below $99. The retreat is real, but so is the supply-risk premium: Hormuz shipping disruptions, attacks on Saudi energy infrastructure and strikes on Russian refineries remain live. Here are the three numbers, the transmission chain and the levels that matter.
    Author  Irene Q.
    8 hours ago
    Brent crude traded near $108.06 on Monday (-1.71%), pulling back from last week's $110 high after Washington moved to ease restrictions on Russian oil flows. WTI hovered around $101 before dipping below $99. The retreat is real, but so is the supply-risk premium: Hormuz shipping disruptions, attacks on Saudi energy infrastructure and strikes on Russian refineries remain live. Here are the three numbers, the transmission chain and the levels that matter.
    placeholder
    Gold retests $4,200 as dollar and yields retreat — can bullion clear its hardest level?Spot gold traded near $4,175 on Monday (+0.23%), with an intraday high of $4,187.71 after last week's $4,073 ~ $4,217 range; COMEX futures briefly topped $4,200. The dollar slipped to 101.76 and 10-year yields eased from their highs, but October Fed hike odds near 52% and BofA's sub-$4,000 call still cap the upside. Here are the drivers, the levels and what would flip the script.
    Author  Irene Q.
    8 hours ago
    Spot gold traded near $4,175 on Monday (+0.23%), with an intraday high of $4,187.71 after last week's $4,073 ~ $4,217 range; COMEX futures briefly topped $4,200. The dollar slipped to 101.76 and 10-year yields eased from their highs, but October Fed hike odds near 52% and BofA's sub-$4,000 call still cap the upside. Here are the drivers, the levels and what would flip the script.
    placeholder
    Gold defends $4,100 as BofA targets a break below $4,000 — why the Middle East bid is missingSpot gold flushed to $4,099.89, a whisker above October's $4,090 low, then rebounded to close at $4,138.25 (+0.82%) — even as US CPI ran hot. Bank of America sees gold below $4,000 within three months, citing shrinking demand and official-sector selling. Here are the levels, the drivers and what would flip the script.
    Author  Irene Q.
    Oct 15, Thu
    Spot gold flushed to $4,099.89, a whisker above October's $4,090 low, then rebounded to close at $4,138.25 (+0.82%) — even as US CPI ran hot. Bank of America sees gold below $4,000 within three months, citing shrinking demand and official-sector selling. Here are the levels, the drivers and what would flip the script.
    placeholder
    US September CPI recap: inflation hits 3.7% as core runs hot — is an October Fed hike back on the table?September CPI landed hot: headline 3.7% y/y, core 2.6% y/y and 0.3% m/m. October hike odds jumped from ~22% to ~37% — yet the dollar faded to 101.74, gold closed higher and the S&P 500 fell 1.11%. Here is the full repricing, the levels and what to watch next.
    Author  Irene Q.
    Oct 15, Thu
    September CPI landed hot: headline 3.7% y/y, core 2.6% y/y and 0.3% m/m. October hike odds jumped from ~22% to ~37% — yet the dollar faded to 101.74, gold closed higher and the S&P 500 fell 1.11%. Here is the full repricing, the levels and what to watch next.
    placeholder
    US September CPI Preview: Inflation May Heat Up, How Will US Stocks, Dollar and Gold React?The U.S. will release its September CPI data on Wednesday (October 14) Eastern Time, which will be one of the most important inflation reports ahead of the Federal Reserve's October 27-28
    Author  TradingKey
    Oct 13, Tue
    The U.S. will release its September CPI data on Wednesday (October 14) Eastern Time, which will be one of the most important inflation reports ahead of the Federal Reserve's October 27-28
    Live Quotes
    Name / SymbolChart% Change / Price
    USDJPY
    USDJPY
    0.00%0.00
    EURJPY
    EURJPY
    0.00%0.00
    GBPJPY
    GBPJPY
    0.00%0.00
    JPN225
    JPN225
    0.00%0.00
    USDOLLAR-F
    USDOLLAR-F
    0.00%0.00

    USD Related Articles

    • Financial Markets 2026: Volatility Catalysts in Gold, Silver, Oil, and Blue-Chip Stocks—A CFD Trader's Outlook
    • Best Currency Pairs To Trade 2026: Guide to Choosing Currency Pairs
    • Trading Chart Patterns:Ultimate Guide to Price Action
    • Australian Dollar Forecast In 2024/2025/2026: Should I Buy AUD/USD Or Other AUD Currency Pairs?
    • AUD/USD holds above 0.6500, eyes on RBA Minutes

    Click to view more