

Understanding the first crypto market crash of 2024 and what to expect next

- Gold Price Forecast: Gold Poised to Break $4,200 as Oil Price Slump Eases Inflation Fears
- Gold declines despite easing concerns over inflation, interest rate hikes
- Gold Price Forecast: Oil Price Breaking $100 Fuels Inflation Concerns, Will Gold Prices Fall Further?
- Fed Decision Eve: 104 Economists Expect No Change; Why Is Citadel Securities Betting on a Surprise Hike?
- Gold Price Forecast: Can Gold Hold $4,020 as Fed Rate Hike Expectations Rise?
- Middle East War updates: US-Iran pause strikes as Trump weighs up diplomatic options

●The crypto market crash of January 3 caused roughly $600 million in liquidations across the board.
●This move was mainly influenced by Matrixport’s research, which indicated a possibility of ETF rejection.
●The sudden nosedive wiped nearly $1 billion in open interest in just a few hours.
The cryptocurrency ecosystem was hit with a massive spike in selling pressure that triggered $520 million worth of long positions and nearly $30 million worth of short positions to be liquidated. One of the main reasons why the crypto market dropped on January 3 was Matrixport’s blog that suggested a potential delay in ETF approval from the US Securities and Exchange Commission (SEC).
Let’s break down the first major crypto market crash of 2024.
Why did crypto drop?
On January 3, the first trading week of 2024, Matrixport, a popular digital asset company, posted a blog titled “Why the SEC will reject all Bitcoin spot ETFs.” This post authored by Markus Thielen, the Head of Research at Matrixport indicated that the filed ETFs were missing a critical requirement, which could cause the approval of Bitcoin spot ETFs to be pushed until the second quarter of 2024.
The research also noted, “The current five-person voting Commissioners leadership critical for the ETF approval of the SEC is dominated by Democrats. SEC Chair Gensler is not embracing crypto in the US, and it might even be a very long shot to expect that he would vote to approve Bitcoin Spot ETFs.”
The Matrixport research further added that a crash could wipe $5.1 billion in longs added due to the ETF approval news could be wiped. This move, in theory, should cause Bitcoin price to drop by 20% to anywhere between $36,000 and $38,000.
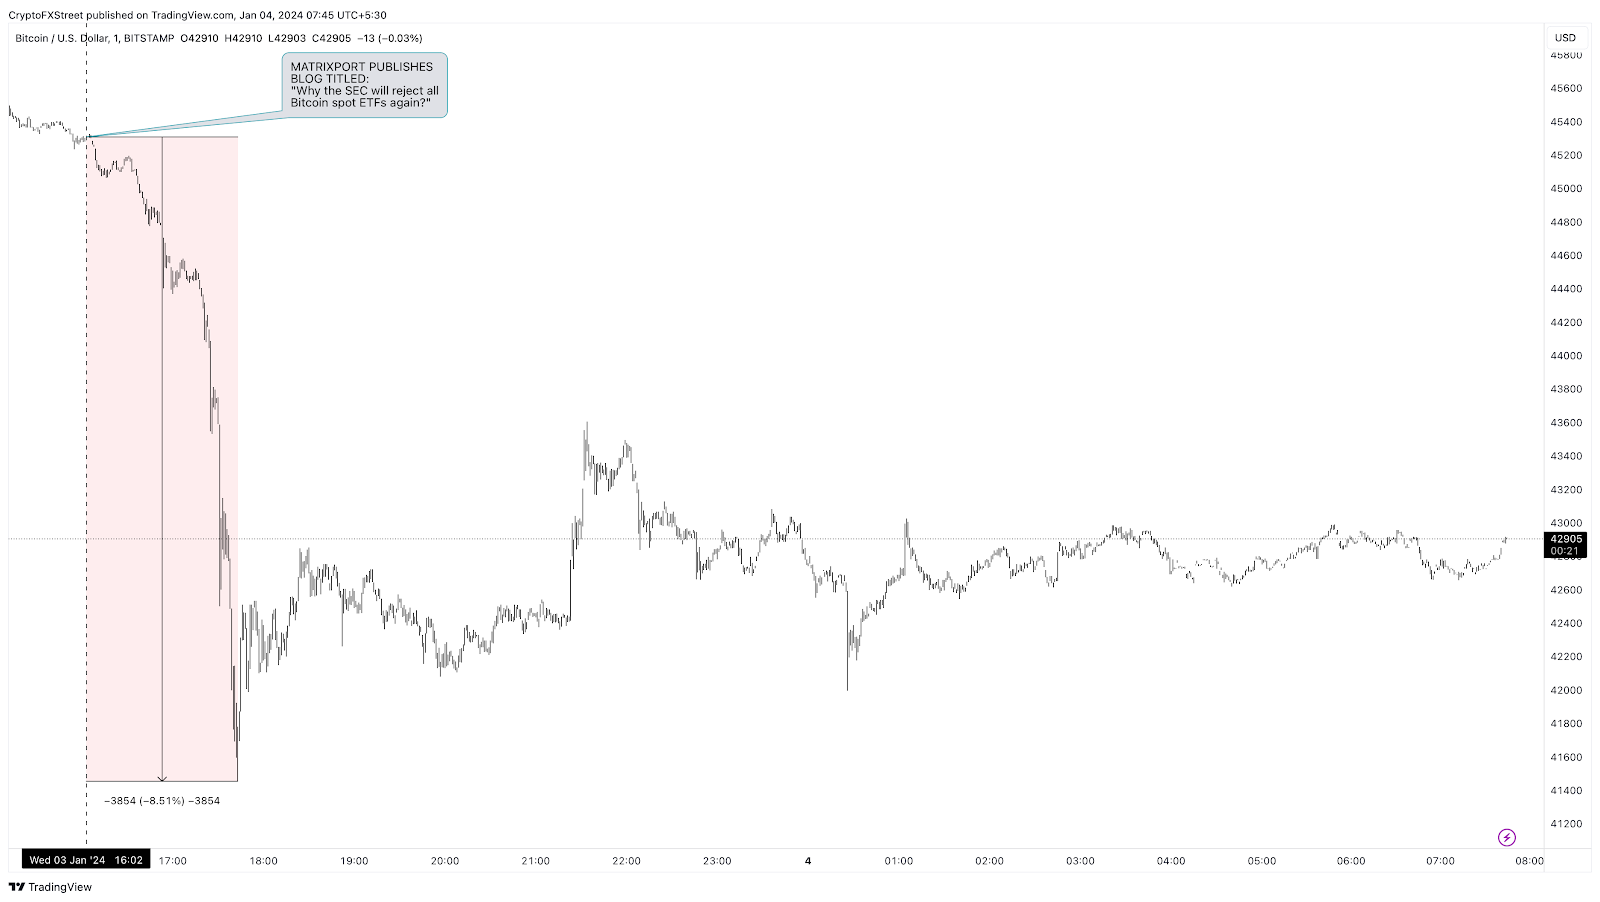
BTC/USD 1-minute chart, Source: TradingView.
Crypto crash and its after-effects
Bitcoin price crashed from $45,308 to $41,454. This drop of 8.51% triggered nearly $600 million in positions to be liquidated, according to data from Coinglass. Additionally, the total open interest, which is the sum of all open positions, slumped from $18.66 billion to $17.72 billion.
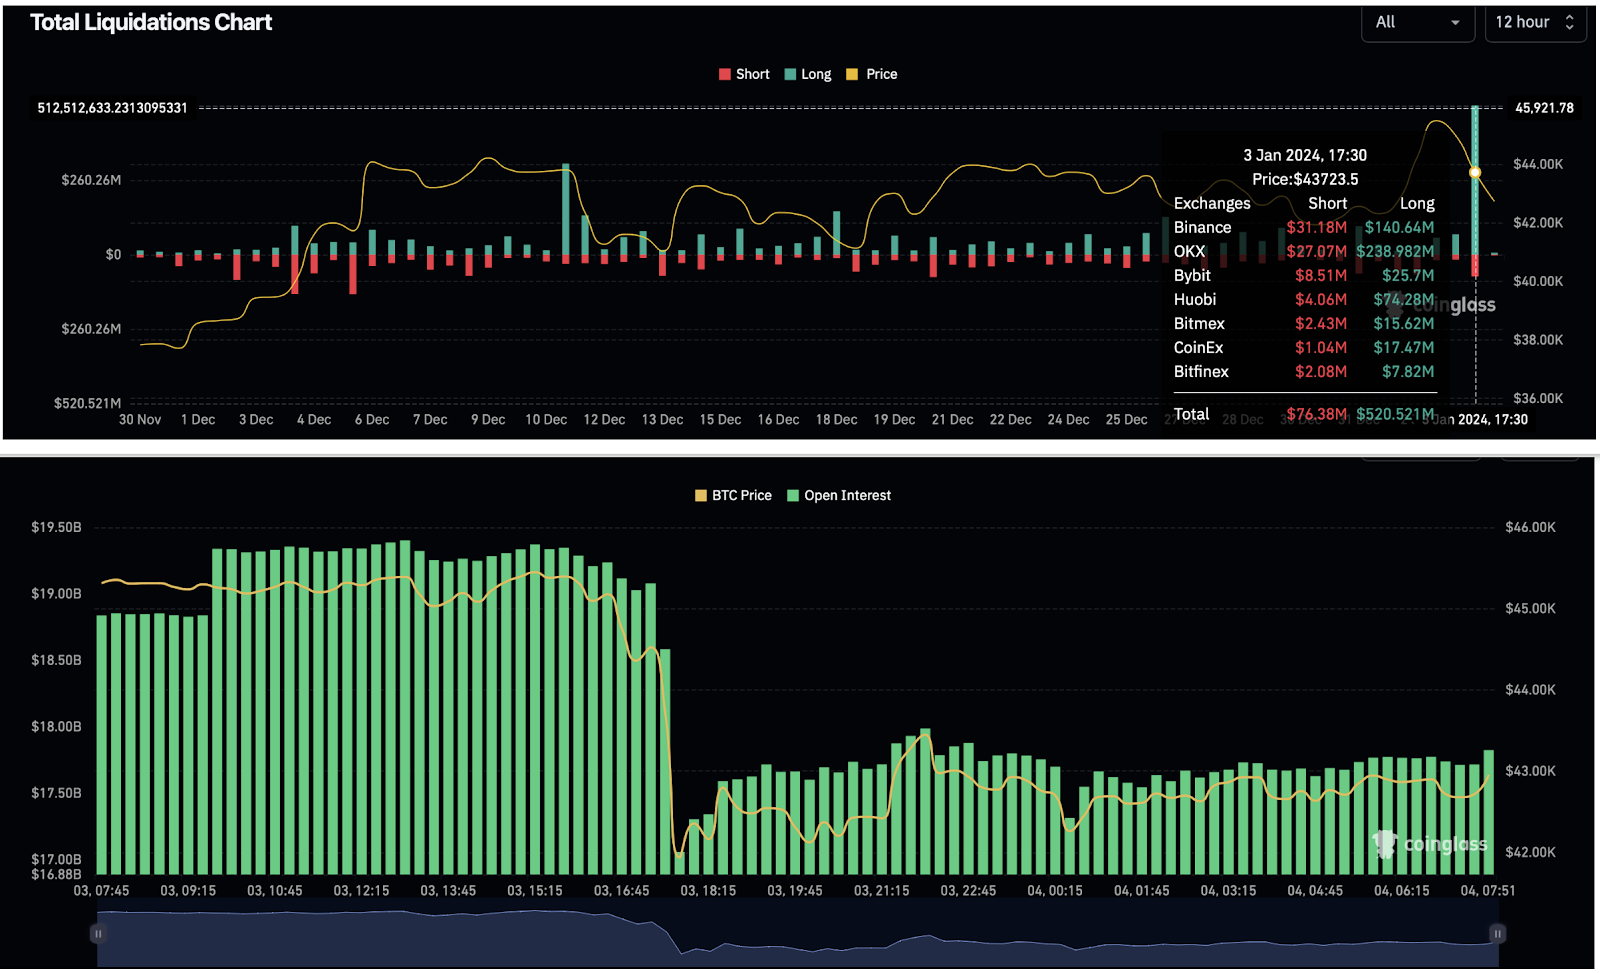
Coinglass liquidation, open interest, Source: Coinglass.
Additionally, the estimated leverage ratio also saw a steep decline due to the January 3 crypto crash. The estimated leverage ratio is the exchange's open interest divided by their coins reserve. This indicator has dropped from a peak of 0.23 to 0.17, representing an effective 50% reduction in leverage.This flush in the estimated leverage ratio often suggests a reduction in risk and a potential bottom formation.
Will crypto market crash more?
The 365-day Market Value to Realized Value (MVRV) ratio currently sits at 33.15%, denoting that 33.15% of investors that purchased BTC over the past year are in profits. If these investors decide to book profits, it could catalyze another crash.
Hence, the 365-day MVRV ratio indicates that this crash could just be the start, especially if Matrixport’s forecast of the SEC rejection of Bitcoin spot ETFs is true. In case the ETFs are rejected until Q2 2024, BTC could repeat the 2019 mini-cycle and potentially catalyze a steep correction.
While Matrixport’s targets for an ETF rejection are $36,000 to $38,000, a dire scenario could see BTC tag the $30,000 psychological level and potentially bottom by sweeping the equal lows at roughly $24,800.
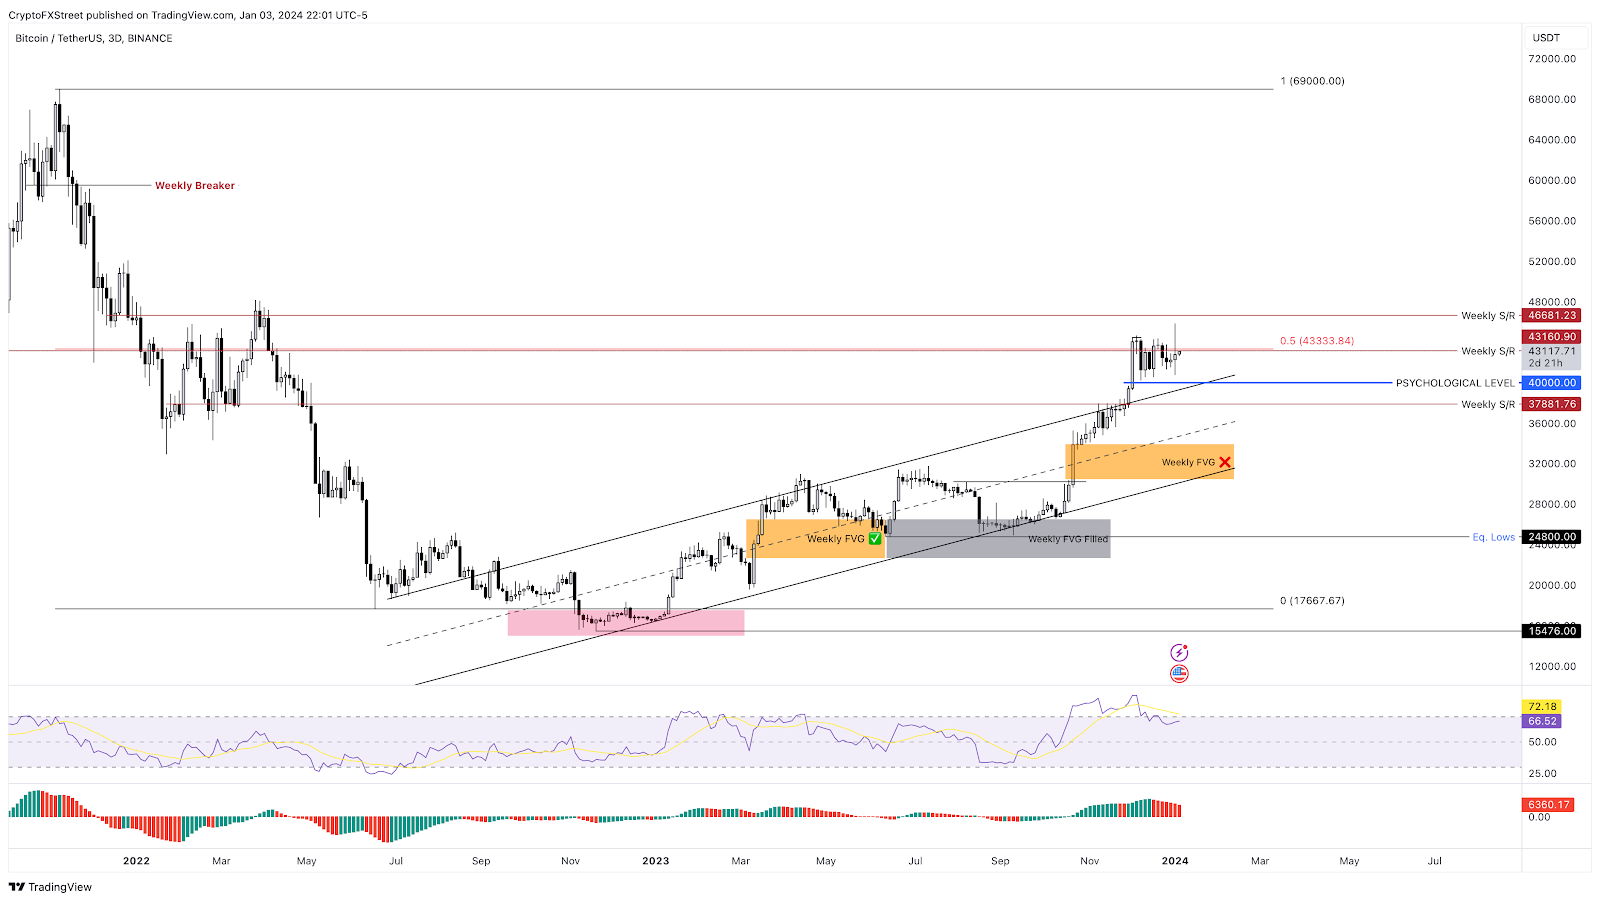
BTC/USDT 1-week chart, Source: TradingView.
Read more
* The content presented above, whether from a third party or not, is considered as general advice only. This article should not be construed as containing investment advice, investment recommendations, an offer of or solicitation for any transactions in financial instruments.


