

Dogecoin Price Forecast: DOGE holds a neutral tone with emerging downside risks

Source Fxstreet
  • Dogecoin trades in the red on Tuesday after being rejected at the key resistance level the previous day.
  • On-chain and derivatives data back bearish sentiment with declining social dominance, negative funding rates and rising short bets.
  • The technical outlook suggests a neutral stance with a slight bearish tilt, as momentum indicators signal weakening strength.

Dogecoin (DOGE) continues to trade below $0.091 on Tuesday as it started the week with mild selling, falling to break above key resistance. The price action remains largely range-bound, and underlying metrics are beginning to tilt bearish. Weakening social interest and negative derivatives data signals fading momentum, leaving meme coin with a neutral outlook but increasing downside risks in the near term.

On-chain and derivatives metrics show bearish bias

Santiment’s Social Dominance metric for Dogecoin supports a bearish outlook. The index measures the share of DOGE-related discussions across the cryptocurrency media. It has been in a downtrend since the end of March, trading at 0.061% on Tuesday, near March lows. This fall indicates fading market interest and sentiment among DOGE investors.

Dogecoin social dominance chart. Source: Santiment

On the derivatives side, CoinGlass’s Dogecoin long-to-short ratio is currently at 0.94 on Tuesday, nearing its lowest level over a month. This ratio is still below 1, reflecting bearish sentiment in the markets, as more traders are betting the asset’s price will fall.
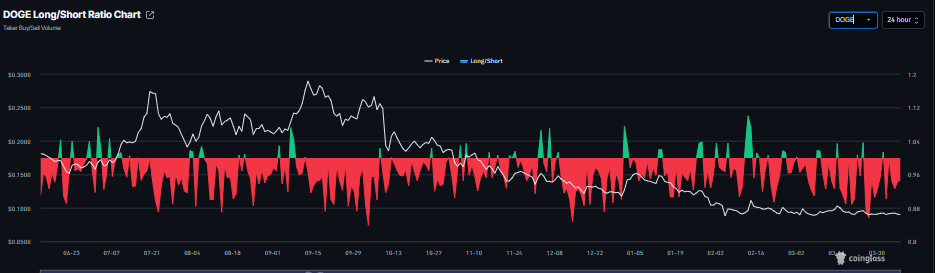
DOGE long-to-short ratio chart. Source: Coinglass

In addition, funding rate data also point to a bearish outlook for Dogecoin. The metric flipped to a negative rate on Monday, reading -0.0087% on Tuesday, indicating shorts are paying longs and suggesting bearish sentiment toward DOGE.
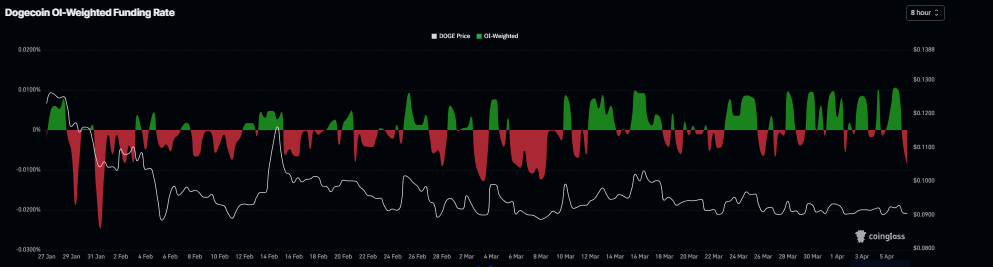
DOGE funding rates chart. Source: Coinglass

Dogecoin Price Forecast: DOGE shows a slight bearish tilt

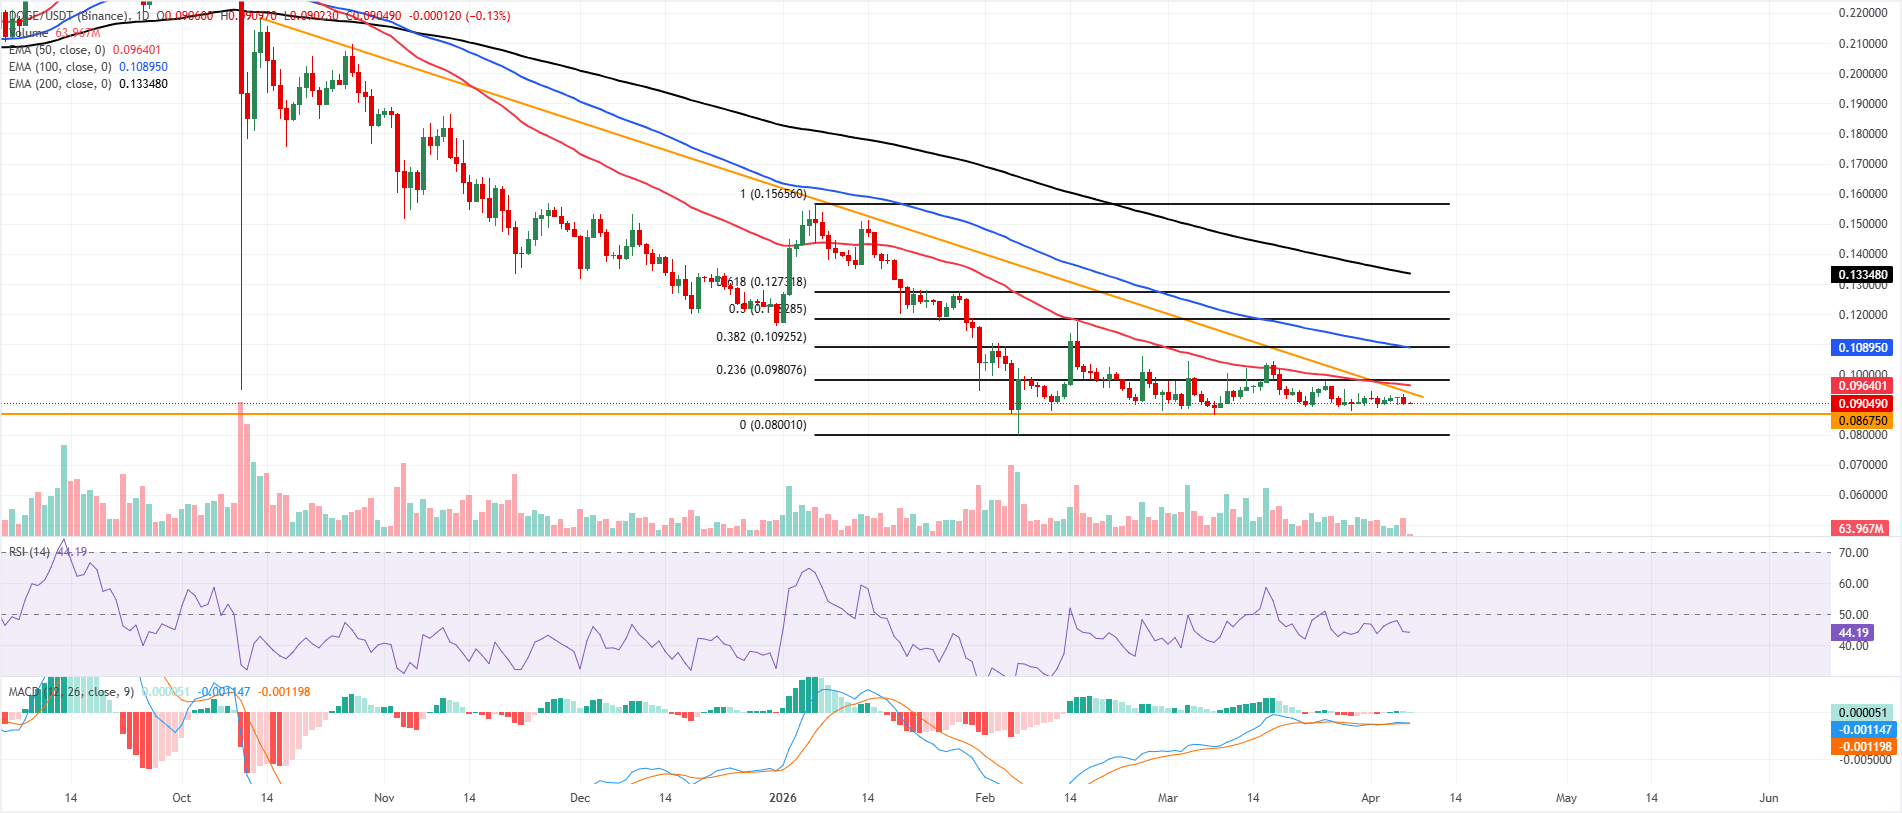
Dogecoin price is trading at $0.090 on Tuesday after falling nearly 2% the previous day. The near-term bias is neutral, with a slight bearish tilt, as price drifts below the 50-day Exponential Moving Average around $0.096 and remains capped well below the declining 100-day and 200-day EMAs near $0.110 and $0.130, respectively. 

The downward trendline around $0.094 now acts as an overhead barrier, with momentum indicators lacking conviction: the Relative Strength Index (RSI) on the daily chart at 44 stays below the 50 midline, while the Moving Average Convergence Divergence (MACD) tracks flat just above zero, hinting at waning upside pressure rather than a clear reversal.

Immediate resistance is clustered at the trendline near $0.094, ahead of the 23.6% Fibonacci retracement from the $0.080 low to the $0.156 high at $0.098, where the 50-day average also converges to form a heavier cap. A sustained break above that zone would expose the 38.2% retracement at $0.109 and the 100-day average, reinforcing a broader recovery. 

On the downside, initial support is seen at the recent lows around $0.089, followed by the horizontal line at $0.086; a close below there would open the way toward the $0.080 region and undermine any emerging basing pattern.
(The technical analysis of this story was written with the help of an AI tool.)

Disclaimer: For information purposes only. Past performance is not indicative of future results.
placeholder
Gold Price Forecast: Gold Eyes Key $4,400 Resistance as Falling Oil Prices Ease Inflation PressureAs of the Asian session on September 21, gold prices (XAUUSD) maintained high-level consolidation intraday today following a strong rebound last week, with the latest price trading around
Author  TradingKey
12 hours ago
As of the Asian session on September 21, gold prices (XAUUSD) maintained high-level consolidation intraday today following a strong rebound last week, with the latest price trading around
placeholder
Crude Oil Price Forecast: Can Brent Hold $100 as Saudi Export Recovery Weighs on Risk Premium?International oil prices fell for a fourth consecutive trading day on Monday, marking their longest losing streak since June. Although Iranian-backed Houthi militants launched fresh attac
Author  TradingKey
12 hours ago
International oil prices fell for a fourth consecutive trading day on Monday, marking their longest losing streak since June. Although Iranian-backed Houthi militants launched fresh attac
placeholder
Brent slides below $102 after Houthis' first strike on Riyadh — why oil can't hold $100Houthi forces struck Riyadh for the first time on September 19 and hit Yanbu facilities — yet Brent opened at $104.71, peaked at $104.90 and settled at $101.68 (-1.63% on the day). Here is the four-way data tug-of-war between strike escalation and supply recovery, and the two switches that decide where oil goes next.
Author  Irene Q.
17 hours ago
Houthi forces struck Riyadh for the first time on September 19 and hit Yanbu facilities — yet Brent opened at $104.71, peaked at $104.90 and settled at $101.68 (-1.63% on the day). Here is the four-way data tug-of-war between strike escalation and supply recovery, and the two switches that decide where oil goes next.
placeholder
Today’s Market Recap: AI Chip Stocks Gain, SanDisk Surges Nearly 11%, Micron Rises Nearly 4%, Bitcoin Reclaims $80,000Tracking Market TrendsTradingKey - On September 18, Eastern Time, U.S. stocks capped off a volatile week with the three major benchmarks closing mixed. Tech and semiconductor stocks extended their reb
Author  TradingKey
19 hours ago
Tracking Market TrendsTradingKey - On September 18, Eastern Time, U.S. stocks capped off a volatile week with the three major benchmarks closing mixed. Tech and semiconductor stocks extended their reb
placeholder
Bitcoin squeezes back above $80,000 — 110,000 traders liquidated as the hawkish Fed and CLARITY setback fail to hold it down; is $83,000 next?Bitcoin closed above $80,000 on Friday for the first time since September 7, and pushed to $81,299 over the weekend, triggering about $603 million of liquidations — $523 million of them shorts — across more than 110,000 traders. With the Fed's hike already priced and the SEC and CFTC advancing crypto rules after the CLARITY Act failed, here is what stands between BTC and the $83,000 gate.
Author  Suzie
Yesterday 06: 19
Bitcoin closed above $80,000 on Friday for the first time since September 7, and pushed to $81,299 over the weekend, triggering about $603 million of liquidations — $523 million of them shorts — across more than 110,000 traders. With the Fed's hike already priced and the SEC and CFTC advancing crypto rules after the CLARITY Act failed, here is what stands between BTC and the $83,000 gate.
Related Instrument
goTop
quote