


Will Gold Prices Continue to Fall? 2027 Gold Price Trend Analysis and Forecast
Gold 2026 Price Trend Review
TradingKey - In 2026, the international spot gold (XAUUSD) market staged a dramatic surge to new highs followed by a deep correction. In January, extending the momentum of the 2025 bull market, gold prices surged from around $4,300 to break through the $5,000 round-number mark, reaching an all-time high of $5,608 on January 29, before steadily weakening and trending downward.
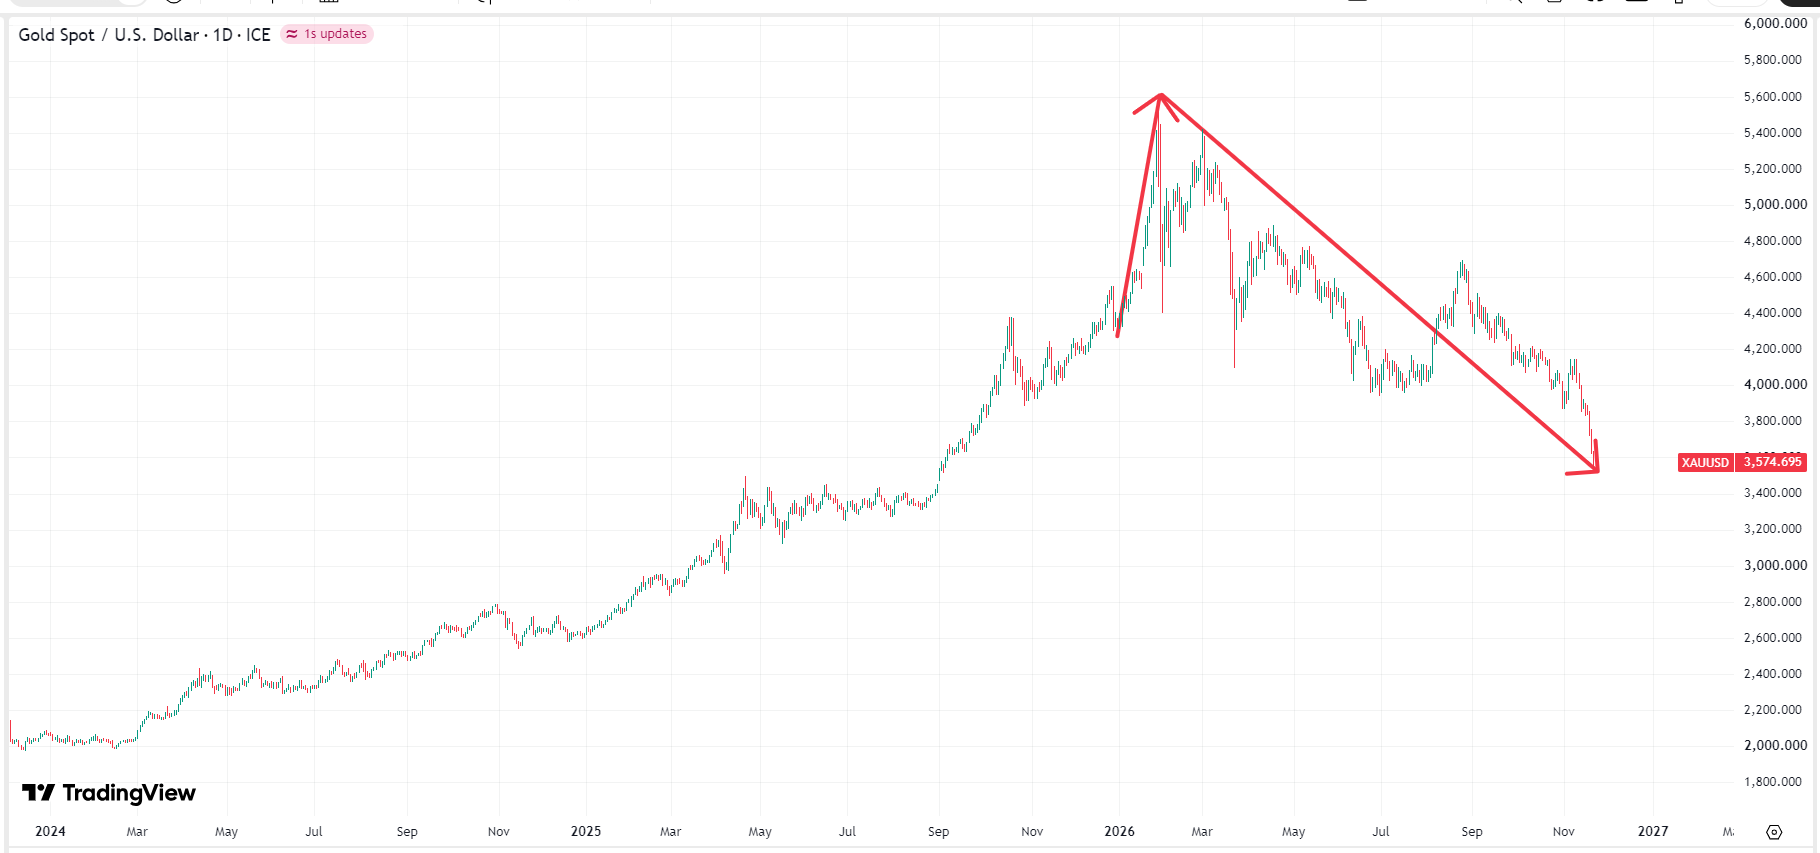
Gold price chart, Source: TradingView
After gold prices peaked in late January, an initial wave of profit-taking selling erupted in early February, plunging more than 20% to $4,400 in just three days, before rebounding strongly to around $5,400 on March 2. Thereafter, gold suffered sharp sell-offs in March, April, and August, with rebound highs never again touching the $5,000 mark and continuing to drift lower, forming a textbook downtrend.
Why Are Gold Prices Falling?
The significant decline and pullback in gold prices in 2026 were not driven by a single factor, but rather resulted from multiple causes acting simultaneously. Early in the year, after gold prices surged past the $5,000 mark, exorbitant prices significantly dampened retail buying sentiment for gold jewelry, bars, and coins in major physical gold-consuming nations such as India and China. This led end consumers to adopt a wait-and-see approach or even cash in near record highs, leaving the physical market without sufficient retail buying support at critical price levels.
Heading into the fall of 2026, several key U.S. inflation figures, including the CPI and PPI, came in hotter than market expectations, signaling that inflation was not abating as rapidly as initially hoped and prompting markets to price in higher-for-longer interest rate risks. As a non-yielding asset, gold experienced capital outflows when macro interest rates and fixed-income returns remained persistently high, exacerbating downward pressure on its price.
Driven by macroeconomic tightening expectations, the U.S. Dollar Index climbed above 100 at multiple points during the year, directly increasing the cost of purchasing dollar-denominated gold for non-dollar holders. Meanwhile, the 10-year U.S. Treasury yield remained entrenched in an elevated range of 5.06%–5.14%, drawing substantial institutional capital into the bond market and exerting direct structural pressure on gold prices.
Will Gold Prices Fall Further?
In the short term, gold prices have not yet fully shaken off the pressure of macroeconomic headwinds, and risks of repeated fluctuations, base-building, or short-term pullbacks to test downside support remain. Influenced by earlier higher-than-expected US inflation data, markets continue to price in the risk that the Federal Reserve (Fed) will keep interest rates elevated in December or reassess the pace of rate cuts. As risk-free rates and the US Dollar Index remain strong, non-yielding gold will continue to face near-term pressure from the opportunity cost of capital.
If the Federal Reserve keeps interest rates elevated or even hikes further due to sticky inflation, gold will continue to face headwinds from high real interest rates and a strong US dollar in the first half of 2027, and demand from private investors and gold ETFs may lean conservative. However, as the lagged impact of high interest rates on the real economy and the labor market emerges, the Fed could initiate an easing cycle as early as the second half of 2027. Once rate cuts materialize and the holding cost of non-yielding gold declines, it will serve as a powerful catalyst for gold prices to resume their upward momentum.
Gold 2027 Price Trend Forecast
From the perspective of technical analysis and market patterns, international gold prices are indeed currently trading within a standard medium-term descending channel on both daily and weekly charts. With multiple key moving averages overhead, including the 50-day and 200-day moving averages, diverging downward and exerting overhead resistance, technicals will lack strong rebound momentum if the Federal Reserve (Fed) prolongs the environment of high interest rates and a strong US dollar due to stickier-than-expected inflation. In the process of breaking below the lower boundary of the descending channel and absorbing cross-asset liquidity tightening and institutional deleveraging, it cannot be ruled out that gold prices could further slide on inertia toward the round-number mark of $3,000 to seek historic support.
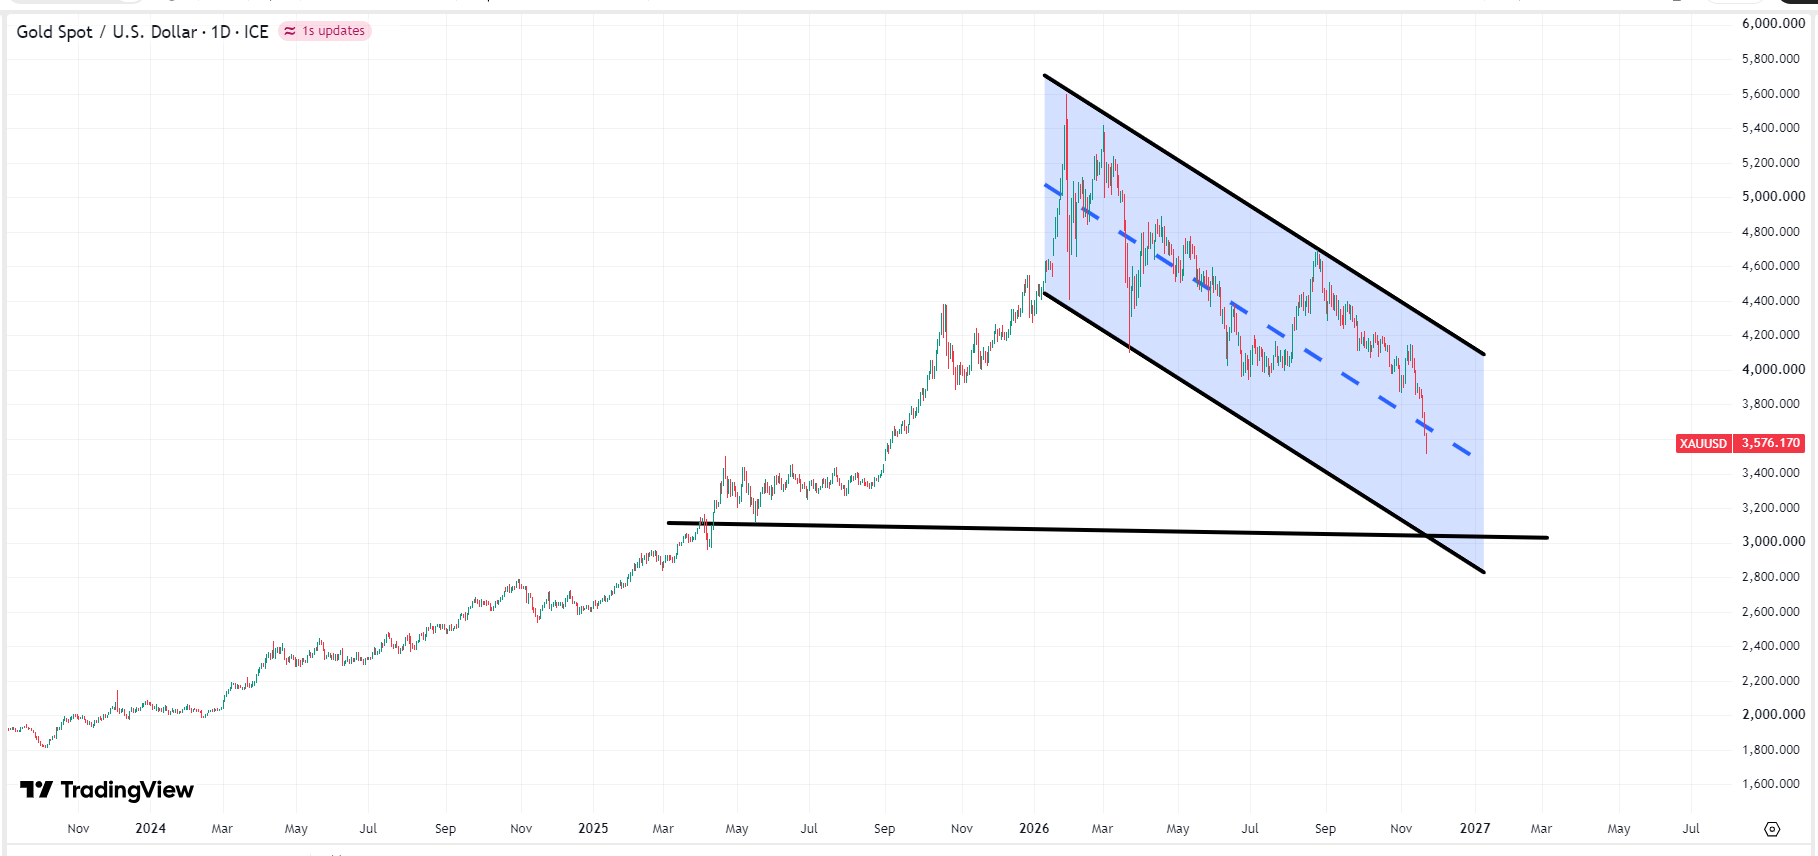 Gold price chart, Source: TradingView
Entering the second half of 2027, as prices approach the ironclad floor of $3,000, technical patterns and market supply and demand will reach a substantive inflection point. In terms of chart patterns, when downward momentum is exhausted and a 'bullish divergence' or a volume concentration zone with long lower shadows emerges at low levels, a phased bottoming signal will be established. At this point, once a macroeconomic slowdown forces the Federal Reserve to restart an easing and rate-cutting cycle, the cost of holding non-yielding assets will drop significantly. This will drive a massive return of sideline safe-haven and speculative capital, helping gold prices stage a strong V-shaped rebound in the second half of the year to steadily regain lost ground and challenge the $4,000 mark.
Recommended Articles


