

USD/CHF Price Forecast: Rebounds toward 0.78 as USD finds support
- USD/CHF rises 0.20% to 0.7786 after rebounding from 0.7747 session low.
- Break above 0.7810 could expose 0.7878 and the 0.7900 level.
- Drop below 0.7750 risks slide toward 0.7700 and the 0.7601 support.
The USD/CHF recovers some ground on Tuesday, rises a modest 0.20% as the US Dollar recovers from earlier losses as risk appetite remains deteriorated as depicted by Wall Street, with three of the fourth US indices ending with losses. At the time of writing, the pair trades at 0.7786 after reaching a daily low of 0.7747.
USD/CHF Price Forecast: Technical outlook
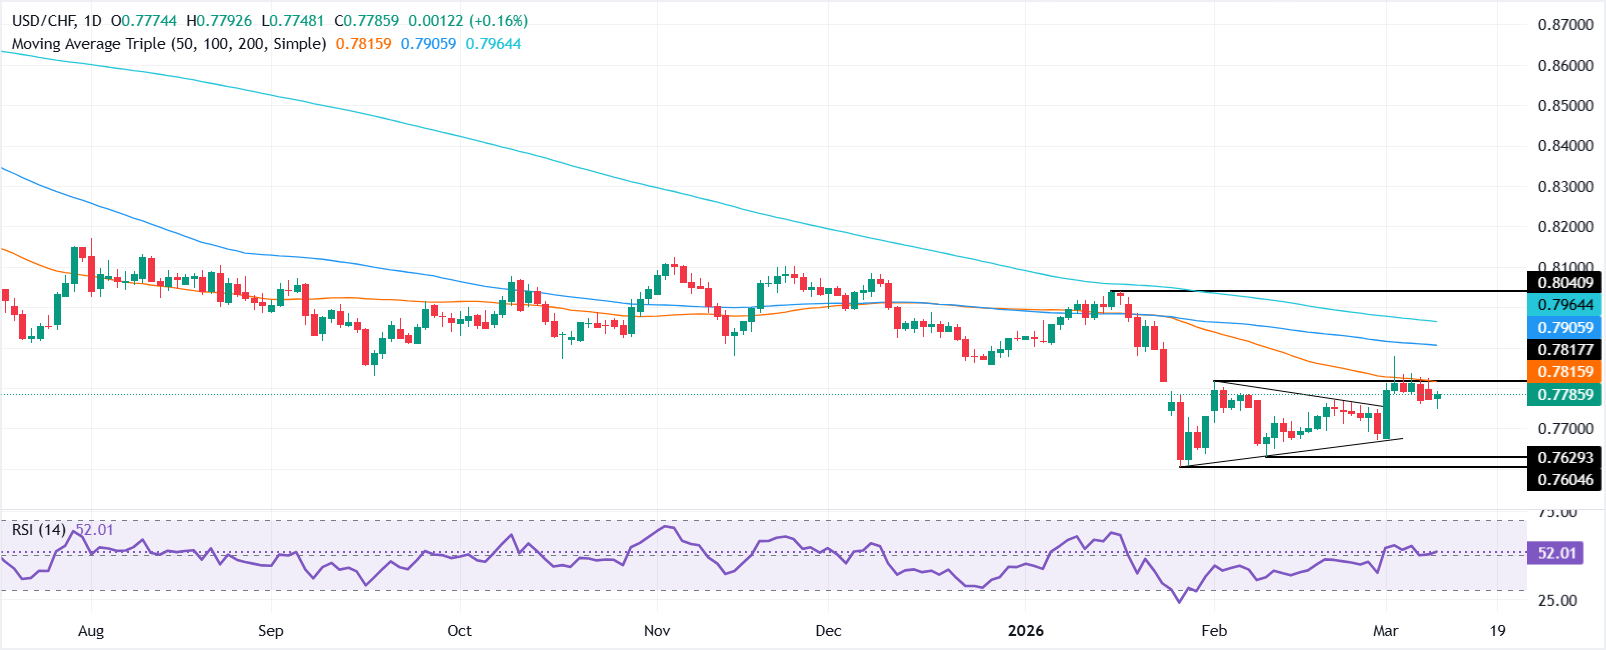
The technical picture shows some consolidation, with the USD/CHF unable to continue its downtrend, with buyers poised to push the exchange rate past the 50-day Simple Moving Average (SMA) of 0.7810.
Momentum reveals that buyers seem to gather some steam as depicted by the Relative Strength Index (RSI), piercing above its neutral level and aiming higher.
If USD/CHF clears the 50-day SMA, it could rally towards the March 3 high of 0.7878. A breach of the latter will expose the 0.7900 mark ahead of 0.8000.
Conversely, the USD/CHF first support would be the March 6 daily low of 0.7750. If surpassed, the next area of interest would be a support trendline drawn from current year lows of around 0.7601 which passe near the 0.7670-0.7700 range. A breach of the latter will expose the January 28 swing low of 0.7601.
USD/CHF Price Chart – Daily
Swiss Franc Price This week
The table below shows the percentage change of Swiss Franc (CHF) against listed major currencies this week. Swiss Franc was the strongest against the US Dollar.
| USD | EUR | GBP | JPY | CAD | AUD | NZD | CHF | |
|---|---|---|---|---|---|---|---|---|
| USD | -0.54% | -0.59% | -0.02% | -0.13% | -1.90% | -1.08% | -0.14% | |
| EUR | 0.54% | -0.06% | 0.51% | 0.38% | -1.39% | -0.56% | 0.40% | |
| GBP | 0.59% | 0.06% | 0.62% | 0.45% | -1.33% | -0.47% | 0.46% | |
| JPY | 0.02% | -0.51% | -0.62% | -0.09% | -1.86% | -1.03% | -0.09% | |
| CAD | 0.13% | -0.38% | -0.45% | 0.09% | -1.78% | -0.94% | -0.01% | |
| AUD | 1.90% | 1.39% | 1.33% | 1.86% | 1.78% | 0.84% | 1.81% | |
| NZD | 1.08% | 0.56% | 0.47% | 1.03% | 0.94% | -0.84% | 0.97% | |
| CHF | 0.14% | -0.40% | -0.46% | 0.09% | 0.00% | -1.81% | -0.97% |
The heat map shows percentage changes of major currencies against each other. The base currency is picked from the left column, while the quote currency is picked from the top row. For example, if you pick the Swiss Franc from the left column and move along the horizontal line to the US Dollar, the percentage change displayed in the box will represent CHF (base)/USD (quote).
Recommended Articles


