
Solana Price Forecast: SOL bulls eye $230 as on-chain data and institutional adoption fuel optimism
- Solana price trades in green above $204 on Monday, up more than 6% in the previous week.
- On-chain data supports a bullish outlook, with rising TVL and increasing whale activity among SOL traders.
- The technical analysis suggests further upside potential, with bulls targeting the $230 level next.
Solana (SOL) continues its upward momentum, trading above $204 at the time of writing on Monday, having rallied more than 6% in the previous week. Rising on-chain activity, increasing institutional interest, and growing whale participation signal renewed confidence in the network’s long-term prospects. The technical outlook suggests a further rally, with SOL bulls poised to push the price toward the $230 target.
Solana’s on-chain activity supports a bullish view
DefiLlama data shows that Solana’s Total Value Locked (TVL) increased to $11.83 billion on Monday, up from $10.42 billion on October 11, and is nearing the record high of $13.22 reached on September 14. Rising TVL indicates growing activity and interest in SOL’s ecosystem, suggesting that more users are depositing or using assets on SOL-based protocols.
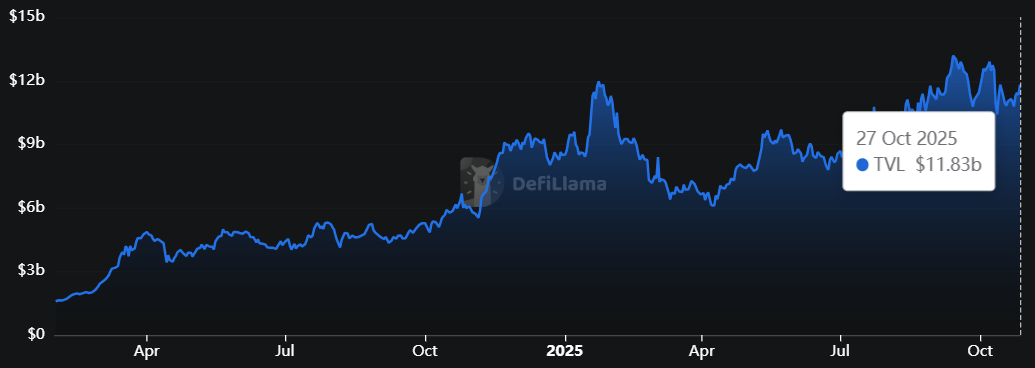
SOL TVL chart. Source: DefiLlama
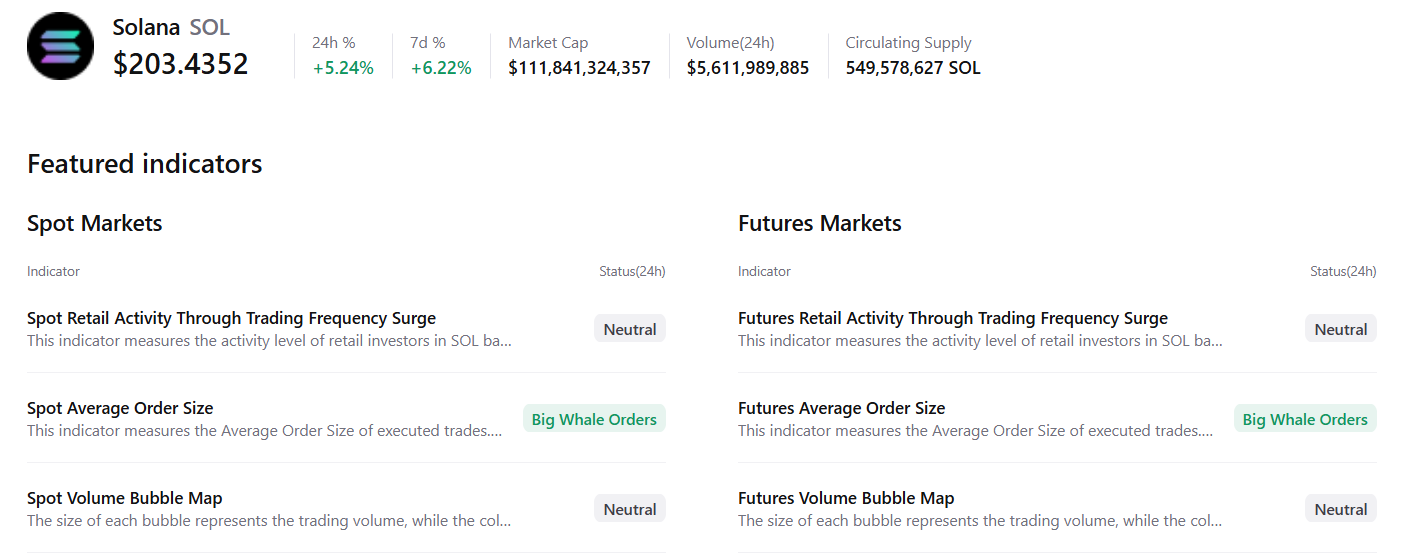
CryptoQuant’s summary data supports the bullish outlook, as SOL’s spot and futures markets show large whale orders and buy dominance, signaling a potential rally ahead.
Additionally, bullish bets on Solana are rising among traders. Coinglass’s long-to-short ratio for SOL reads 1.07 on Monday, the highest level over a month, supporting the bullish sentiment.
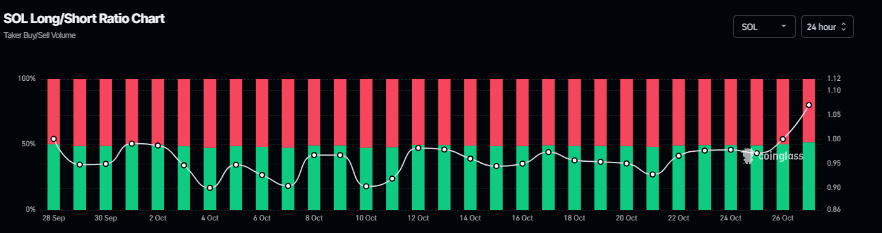
SOL long-to-short ratio chart. Source: Coinglass
Solana’s growing adoption
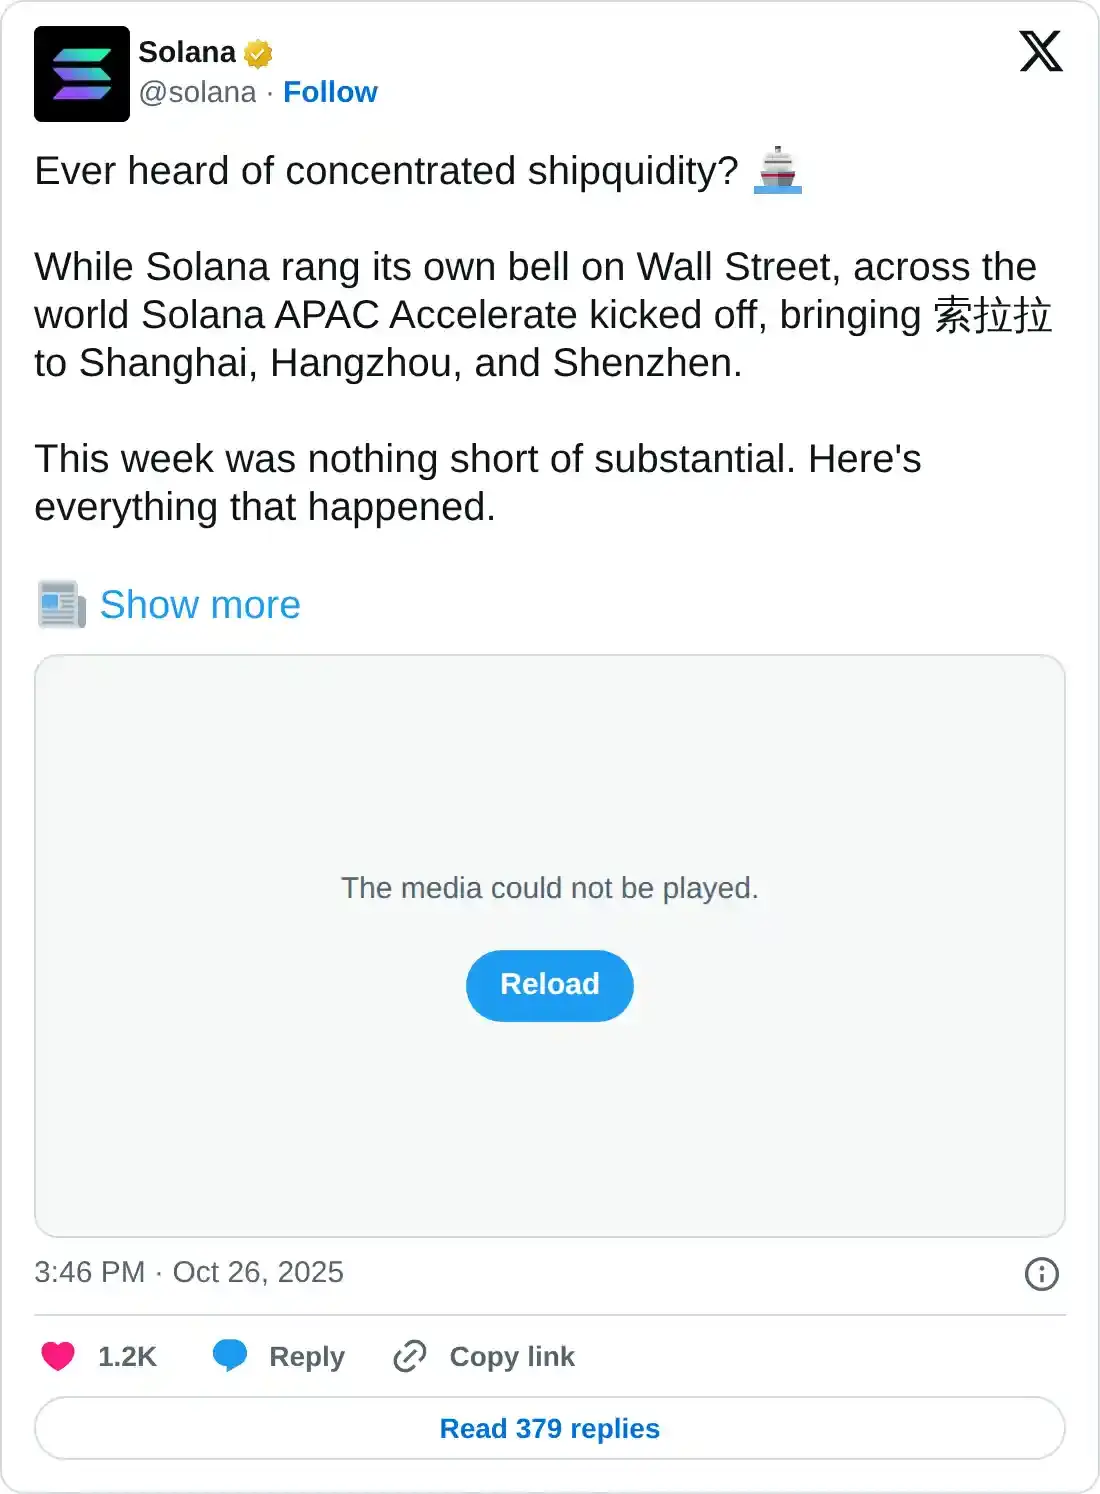
Apart from bullish on-chain and derivatives data, Solana’s ecosystem has seen a wave of positive developments — including Gemini’s launch of the first credit card offering up to 4% instant SOL rewards, the opening of Solana’s new hub at 35 Wall Street, Fidelity granting retail access to SOL, and Hong Kong’s approval of its first Solana Spot ETFs — all underscoring the network’s growing institutional and mainstream adoption.
Solana Price Forecast: SOL bulls aiming for the $230 mark
Solana’s price found support around the ascending trendline on Wednesday and rose by 11% over the next four days. At the time of writing on Monday, SOL is trading above $204.
If SOL closes above the 50-day Exponential Moving Average (EMA) at $202.88 on a daily basis, it could extend the rally toward the next daily support at $230.
The Relative Strength Index (RSI) on the daily chart reads 52, above the neutral level of 50, indicating bullish momentum gaining traction. Additionally, the Moving Average Convergence Divergence (MACD) showed a bullish crossover on Saturday, providing a buy signal and further supporting the bullish view.
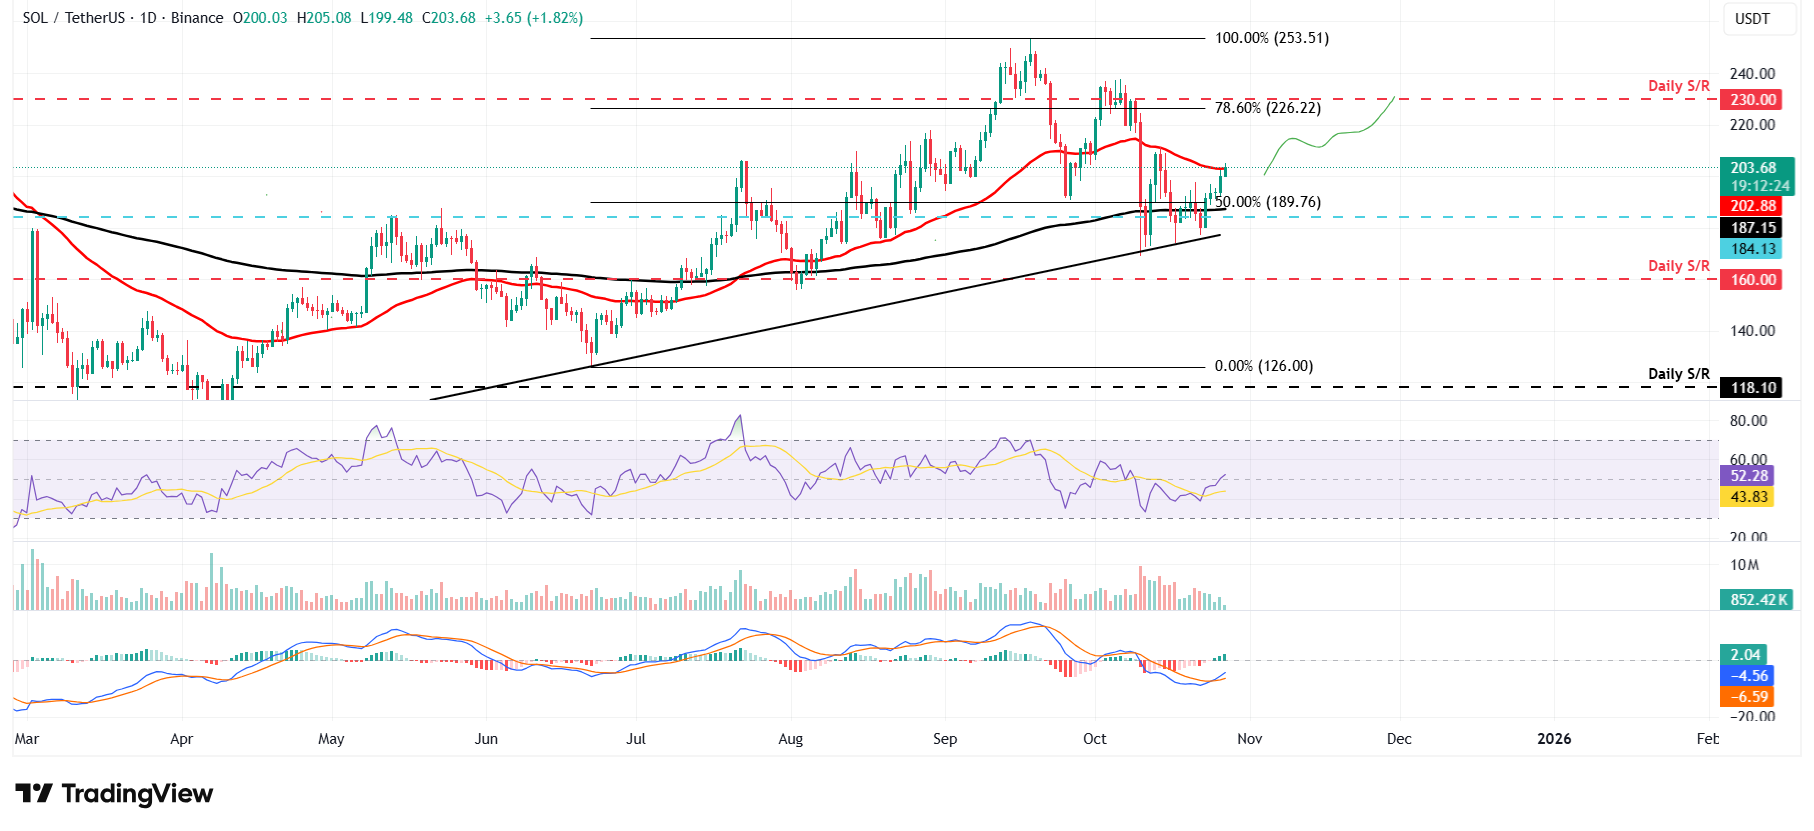
SOL/USDT daily chart
On the other hand, if SOL faces a correction, it could extend the decline toward the 50% retracement level at $189.76.
Recommended Articles


