


Cardano Price Forecast: ADA breaks above falling wedge, upside constrained by geopolitical risks
- Cardano price steadies on Monday after closing above the falling wedge pattern, a move that favors bulls.
- The derivatives market supports a positive outlook, as open interest and long bets are rising among traders.
- Traders should be cautious, as rising geopolitical tensions between the US and Venezuela, and later between the US and Colombia, could limit further upside in ADA.
Cardano (ADA) steadies above $0.40 at the time of writing on Monday after a decisive close above the falling wedge pattern in the previous week. The derivatives market supports improving sentiment, with ADA’s Open Interest (OI) rising and long bets increasing among market participants. However, traders should be cautious as escalating geopolitical tensions between the US and Venezuela, and later Colombia, could cap further gains in ADA.
Cardano’s improving sentiment in derivatives markets
CoinGlass’ data show that Cardano futures OI at exchanges rose to $851.17 million on Monday from $644.34 million on Tuesday, reaching the highest level since mid-December. An increasing OI represents new or additional money entering the market and new buying, which could fuel the current ADA price rally.

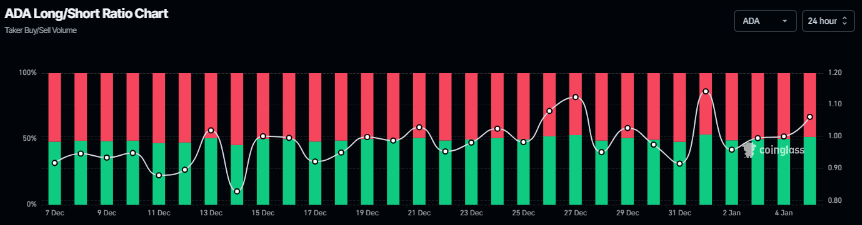
In addition, Cardano’s Coinglass long-to-short ratio has been rising steadily and reads 1.06 on Monday, nearing its monthly high. This ratio, above one, reflects bullish sentiment in the markets, as more traders are betting on the ADA price to rise.
Cardano Price Forecast: ADA closes above the falling wedge pattern
Cardano price broke and closed above the upper trendline of the falling wedge pattern (formed by connecting multiple highs and lows with two trendlines since mid-October) on Friday and rose slightly through Sunday. As of Monday, ADA is trading around $0.40.
If ADA continues its upward momentum, it could extend the rally toward its immediate resistance at $0.42, its 50-day Exponential Moving Average (EMA). A daily close above this level could extend additional gains toward the next daily resistance at $0.49.
The Relative Strength Index (RSI) on the daily chart reads 55, above the neutral level of 50, indicating bullish momentum is gaining traction. In addition, the Moving Average Convergence Divergence (MACD) indicator showed a bullish crossover and rising green histogram bars above the neutral level, further supporting the bullish outlook.
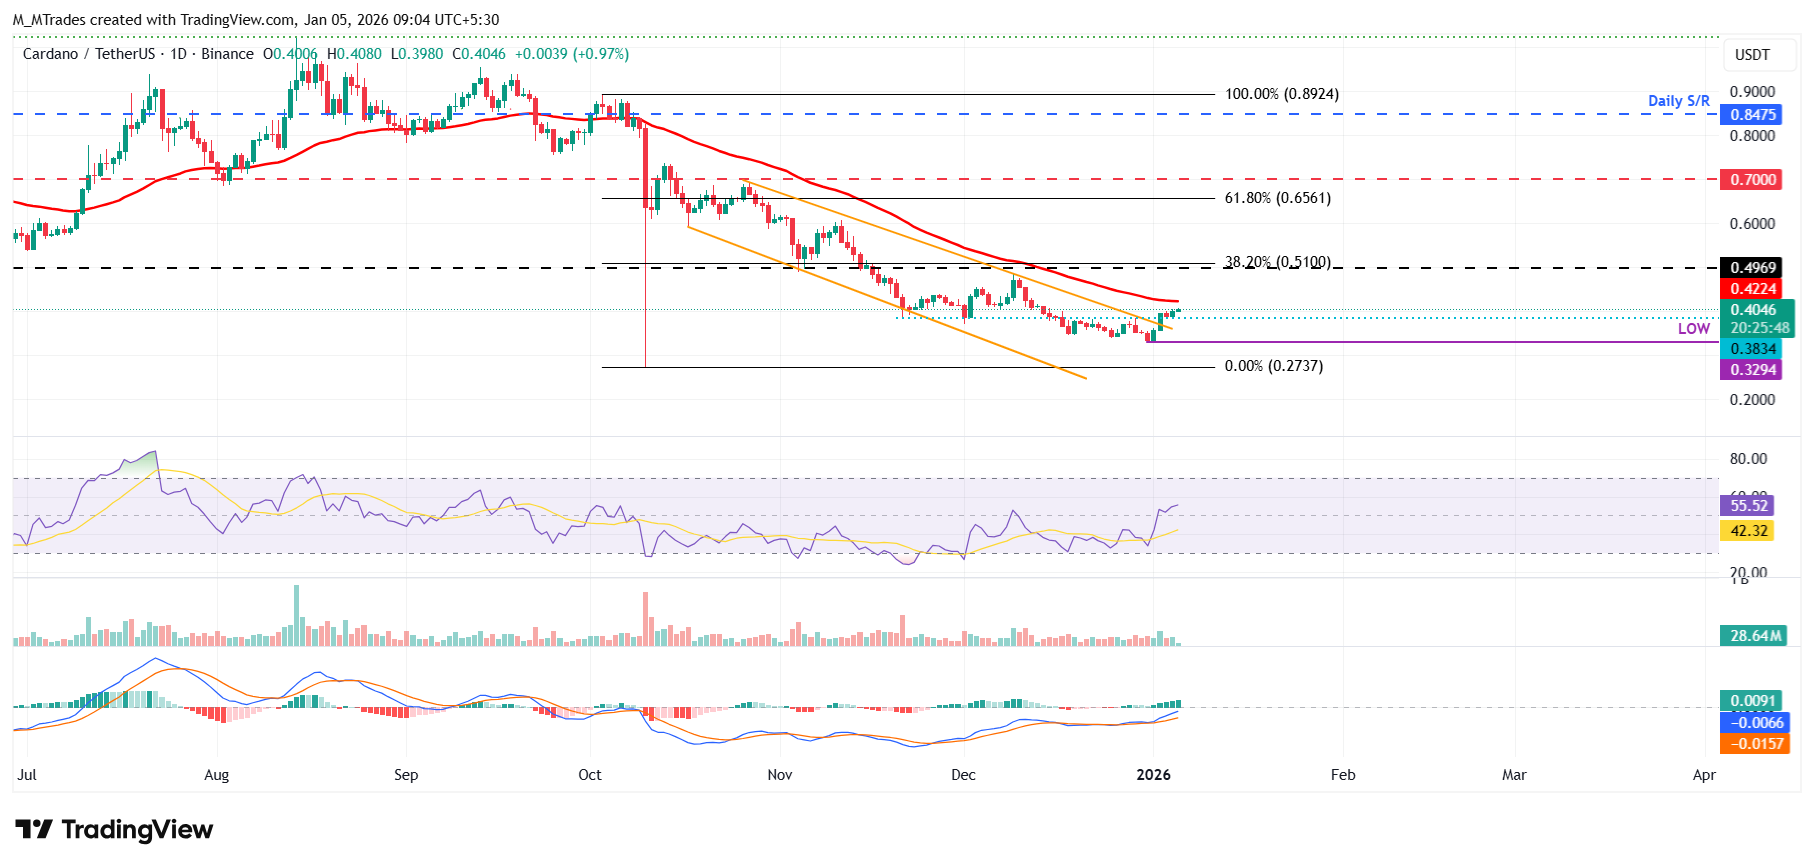
However, if ADA corrects, it could extend the decline to Wednesday’s low of $0.32.
Some signs of concern
Despite a bullish outlook from technicals and derivatives, traders should remain cautious, as rising geopolitical tensions could trigger risk-off sentiment.
On Saturday, the US carried out a large-scale military strike against Venezuela, capturing the Venezuelan leader, President Nicolás Maduro and his wife.
Later on the same day, at a press conference, US President Donald Trump said, “Maduro and his wife both will face US justice, adding that the US will be running Venezuela until they can do a safe, proper, and judicious transition.”
This comes on top of the lack of progress in the Russia-Ukraine peace deal, unrest in Iran, and issues surrounding Gaza, which keep geopolitical risks in play and benefit the US Dollar (USD) status as the global reserve currency, which kicked off the first full trading week of the new year on the front foot.
In addition, Trump's comments on Monday, as cited by the Kobeissi Letter, further raised geopolitical concerns.
Trump stated that “Colombia is run by a sick man” and suggested openness to potential US intervention, remarks that heightened uncertainty and could weigh on risk sentiment.
Such developments could pressure risky assets such as Cardano and could limit the upside momentum.
Recommended Articles


