

Dow Jones Industrial Average flat on Tuesday as investors weigh cautious Fedspeak
- Dow Jones holding steady just below 39,900.00 as investors await meaningful data.
- Despite chilling Fedspeak, investor hopes for rate cuts remains high.
- US Home Sales, PMI, and Durable Goods Orders all still due this week.
The Dow Jones Industrial Average (DJIA) is holding steady above 39,800.00 on Tuesday as Federal Reserve (Fed) policymakers try to apply downward pressure to broad-market rate cut expectations. Fed officials noted on Tuesday that the Fed isn’t likely to cut rates until they get more data pointing to a consistent easing of inflation to the Fed’s 2% annual target. Despite an easing in inflation data for April, central planners remain spooked after inflation data from the overall first quarter failed to show disinflation has taken permanent hold.
USD economic data remains thin in the early half of the trading week, but investors will have an eye out for US Home Sales figures due in the midweek. US Purchasing Managers Index (PMI) figures are also due on Thursday, followed by Durable Goods Orders on Friday.
Dow Jones news
The Dow Jones is mixed on Tuesday, with about half of the index’s constituent securities in the green. 3M Co. (MMM) fell -1.9% to 103.25 per share, while International Business Machines Corp. (IBM) rose over 2% to trade into $173.44 per share.
Dow Jones technical outlook
The Dow Jones set a fresh all-time high of 40,070.82 on Monday, and the index is treading water just below 39,900.00 on Tuesday. DJIA traders couldn’t get the index back over 39,880.00 as bullish momentum remains thin, but selling pressure remains thin and a technical floor is priced in near 39,780.00.
Dow Jones five-minute chart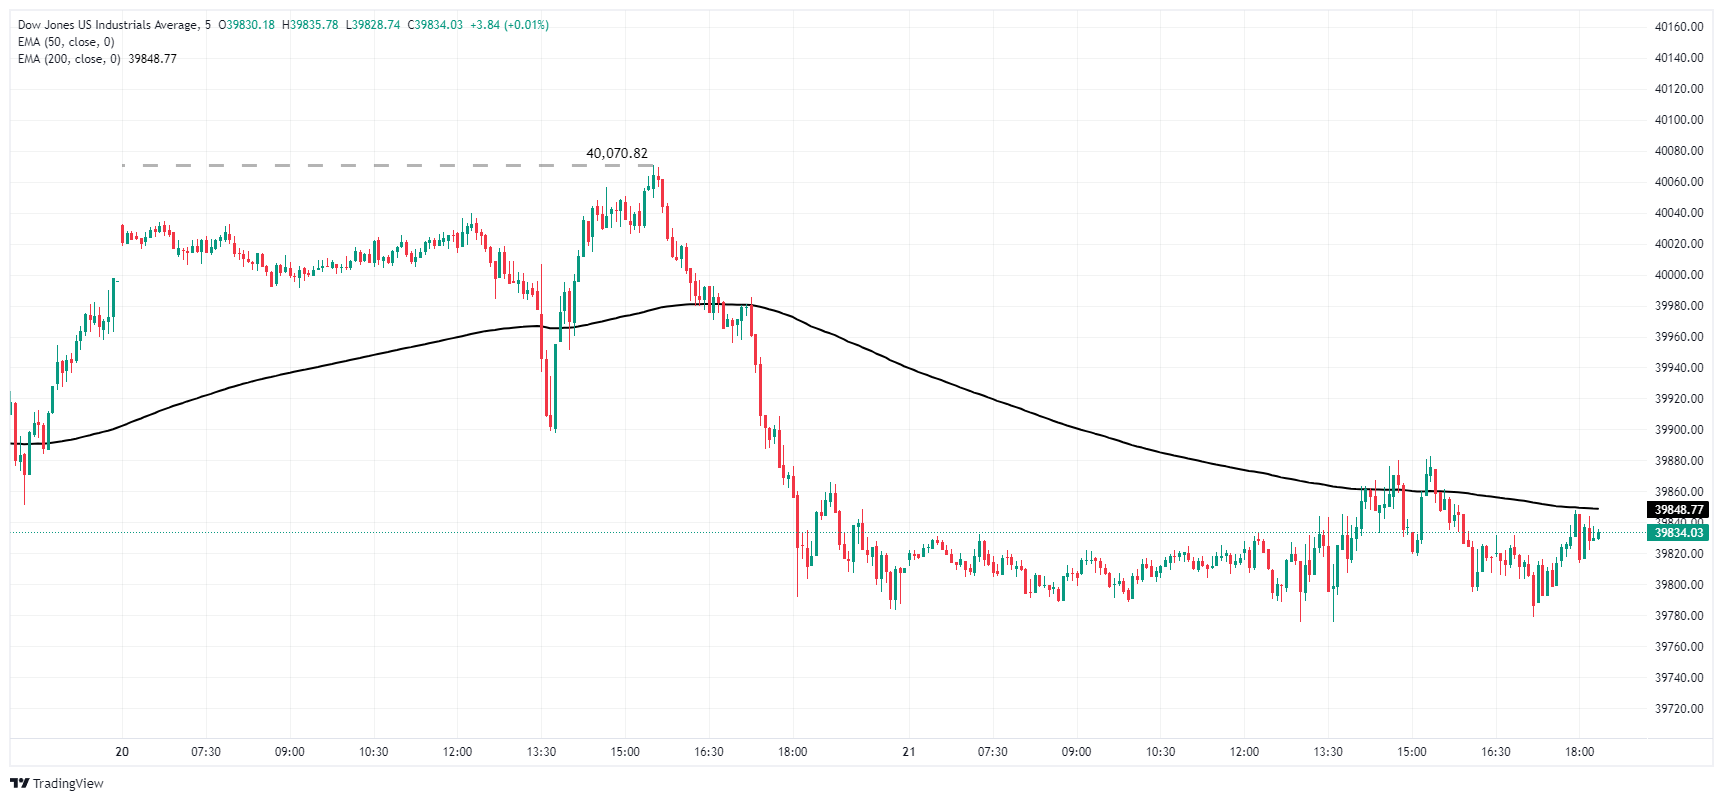
Dow Jones daily chart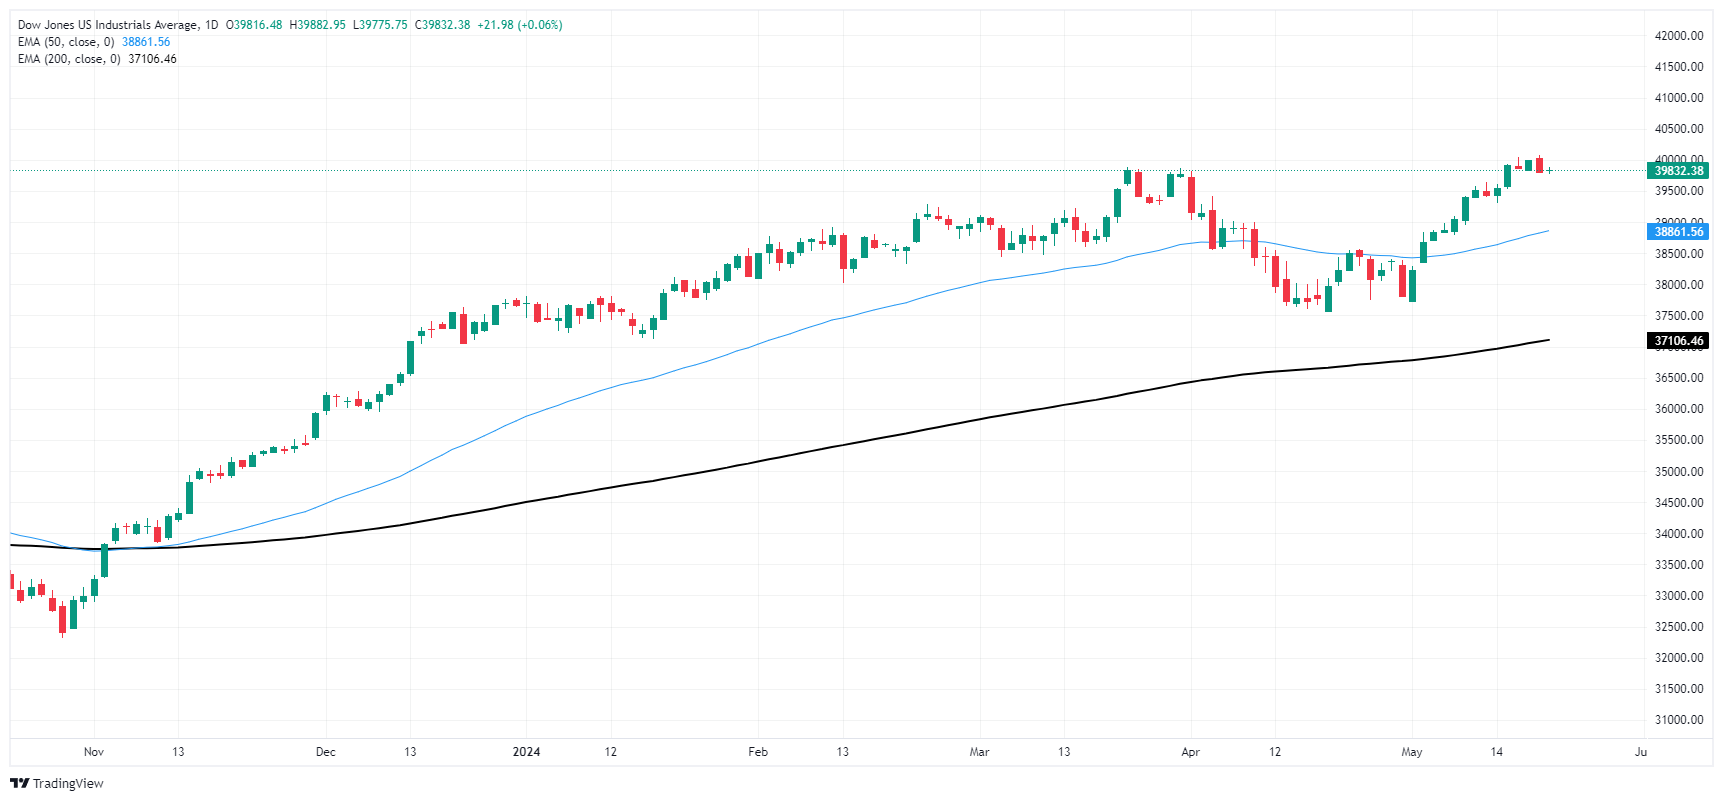
Dow Jones FAQs
The Dow Jones Industrial Average, one of the oldest stock market indices in the world, is compiled of the 30 most traded stocks in the US. The index is price-weighted rather than weighted by capitalization. It is calculated by summing the prices of the constituent stocks and dividing them by a factor, currently 0.152. The index was founded by Charles Dow, who also founded the Wall Street Journal. In later years it has been criticized for not being broadly representative enough because it only tracks 30 conglomerates, unlike broader indices such as the S&P 500.
Many different factors drive the Dow Jones Industrial Average (DJIA). The aggregate performance of the component companies revealed in quarterly company earnings reports is the main one. US and global macroeconomic data also contributes as it impacts on investor sentiment. The level of interest rates, set by the Federal Reserve (Fed), also influences the DJIA as it affects the cost of credit, on which many corporations are heavily reliant. Therefore, inflation can be a major driver as well as other metrics which impact the Fed decisions.
Dow Theory is a method for identifying the primary trend of the stock market developed by Charles Dow. A key step is to compare the direction of the Dow Jones Industrial Average (DJIA) and the Dow Jones Transportation Average (DJTA) and only follow trends where both are moving in the same direction. Volume is a confirmatory criteria. The theory uses elements of peak and trough analysis. Dow’s theory posits three trend phases: accumulation, when smart money starts buying or selling; public participation, when the wider public joins in; and distribution, when the smart money exits.
There are a number of ways to trade the DJIA. One is to use ETFs which allow investors to trade the DJIA as a single security, rather than having to buy shares in all 30 constituent companies. A leading example is the SPDR Dow Jones Industrial Average ETF (DIA). DJIA futures contracts enable traders to speculate on the future value of the index and Options provide the right, but not the obligation, to buy or sell the index at a predetermined price in the future. Mutual funds enable investors to buy a share of a diversified portfolio of DJIA stocks thus providing exposure to the overall index.
Recommended Articles


