

Chainlink Price Forecast: LINK stalls near 200-day EMA following recent gains

Source Fxstreet
  • Chainlink price pauses gains near the 200-day EMA at $9.56, with the 61.8% Fibonacci retracement at $9.39 holding strong.
  • Derivatives metrics show early signs of weakness, potentially limiting LINK’s upside.
  • US-listed spot ETFs recorded an inflow of $2.07 million on Monday, marking their largest single-day inflow since July 22.

Chainlink (LINK) faces resistance near $9.56 on Tuesday and pauses gains after rallying over 14% last week. The cautious tone is supported by weakening derivatives metrics, suggesting bullish momentum may be losing steam. However, renewed demand from institutional investors hints LINK could push higher.

Derivatives traders show signs of weakness

Derivatives data shows early signs of weakness and cautious sentiment among traders. CoinGlass’ long-to-short ratio for LINK reads 0.76 on Tuesday, nearing its lowest levels in a month. A ratio below one indicates bearish sentiment, as traders bet asset prices will fall.
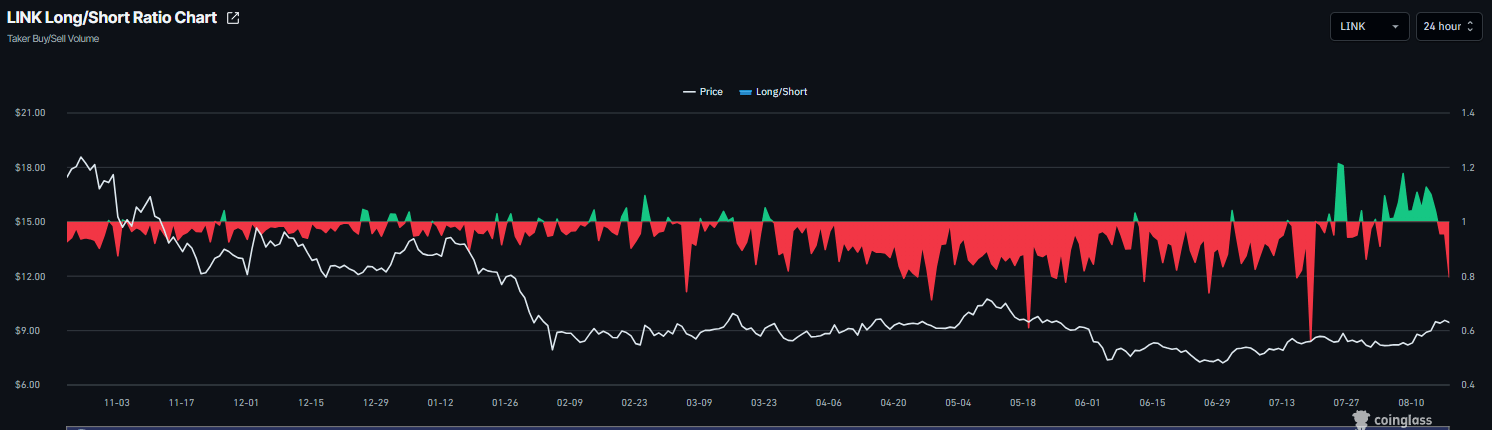
LINK long-to-short ratio chart. Source: Coinglass

In addition, Chainlink’s funding rate flipped negative, reading -0.0050% on Tuesday. This negative rate indicates that short traders are paying longs and reflects a bearish bias.
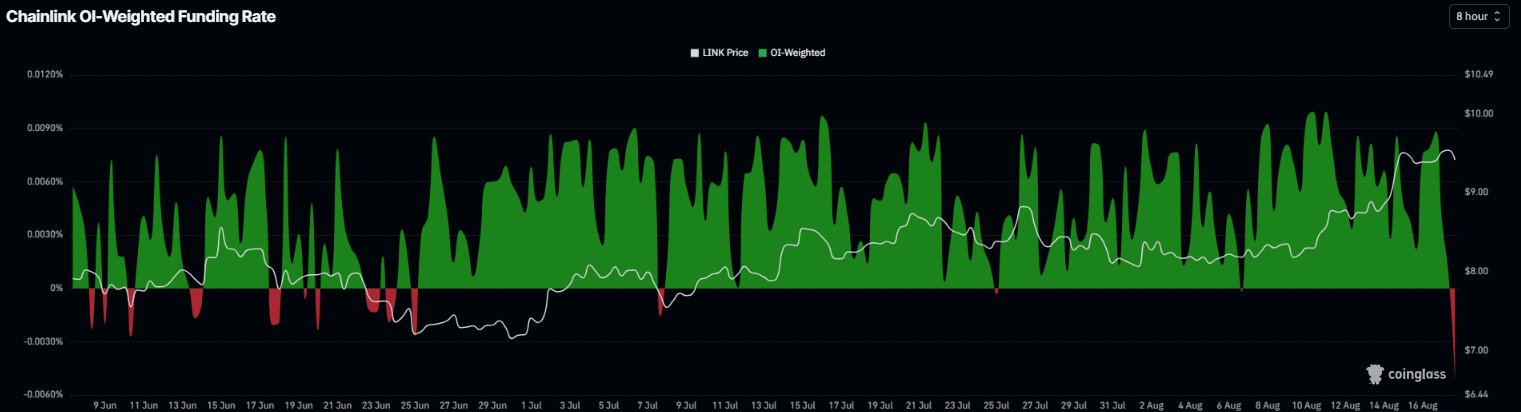
Chainlink funding rates chart. Source: Coinglass

Institutional demand remains strong

Institutional demand started the week on a positive note. SoSoValue data shows that spot LINK ETFs recorded an inflow of $2.07 million on Monday, marking its largest single-day inflow since July 22. If this trend continues and intensifies throughout the week, Chainlink could see a further rally.
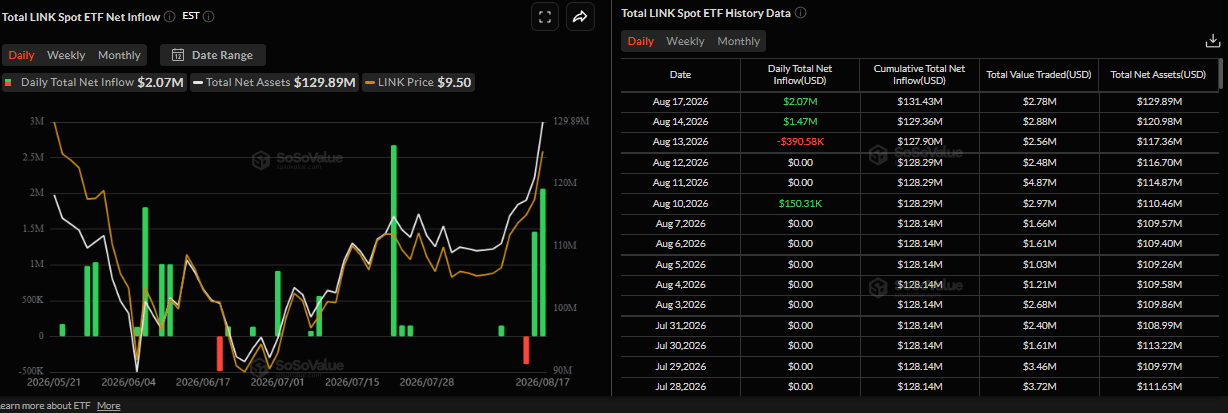
Total LINK spot ETF net inflow daily chart. Source: SoSoValue

Chainlink Price Forecast: LINK struggles near 200-day EMA

Chainlink price trades at $9.42 on Tuesday, holding above the 50-day and 100-day Exponential Moving Averages (EMAs) at $8.50 and $8.60, reinforcing a mildly constructive bias despite the pair still trading below the 200-day EMA at $9.56. 

LINK has reclaimed the 61.8% Fibonacci retracement at $9.39 as immediate support. At the same time, the Relative Strength Index (RSI) at 67 sits just shy of overbought territory, and the Moving Average Convergence Divergence (MACD) remains positive, together suggesting that upside momentum is firm but approaching a potentially stretched zone.

On the downside, initial demand is seen at the 61.8% Fibonacci retracement at $9.39, followed by a broader support band around the 50% retracement level at $8.94 and the clustered 100-day and 50-day EMAs at $8.60 and $8.50, which underpin the medium-term floor.

On the topside, buyers face first resistance at the 200-day EMA at $9.56, ahead of the horizontal barrier at $9.92; a daily close above these caps would open the way toward the 78.6% Fibonacci retracement at $10.04, with the cycle high region near $10.87 remaining a distant bullish objective.
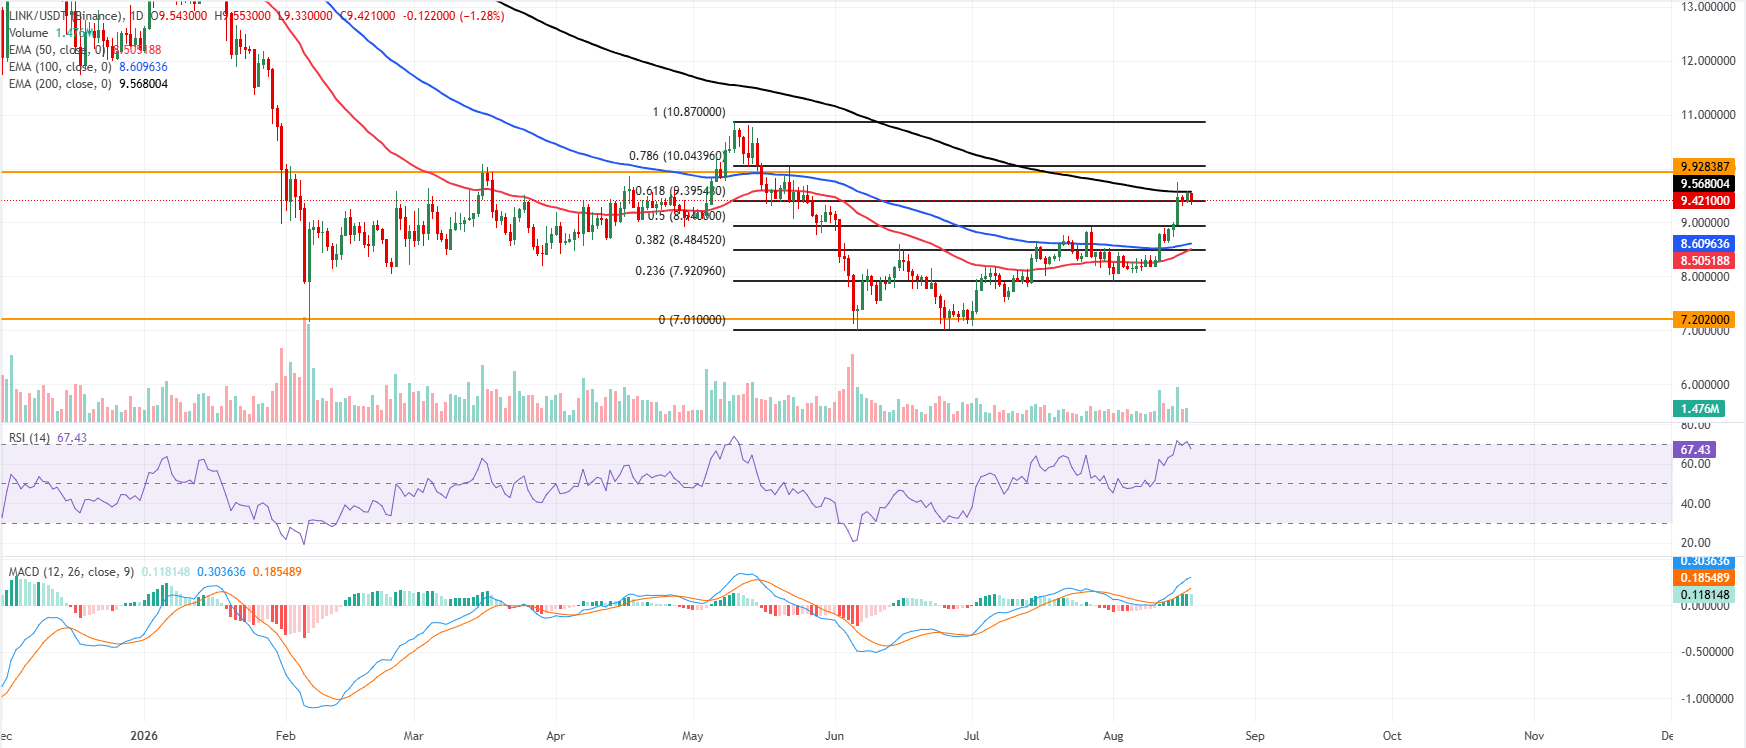
LINK/USDT daily chart

(The technical analysis of this story was written with the help of an AI tool. Know more.)

Disclaimer: For information purposes only. Past performance is not indicative of future results.
placeholder
Gold Price Forecast: XAU/USD recovers some lost ground above $2,050, US ADP report eyedGold price (XAU/USD) bounces off the multi-day lows near $2030 per ounce and hovers around $2,042 during the early Asian session on Thursday.
Author  FXStreet
Jan 04, 2024
Gold price (XAU/USD) bounces off the multi-day lows near $2030 per ounce and hovers around $2,042 during the early Asian session on Thursday.
placeholder
Gold prices rise to over one-month high on softer dollar, bond yieldsGold prices climbed on Tuesday to their highest point in more than a month, supported by a weaker U.S. dollar and lower Treasury yields.
Author  Reuters
Jul 22, 2025
Gold prices climbed on Tuesday to their highest point in more than a month, supported by a weaker U.S. dollar and lower Treasury yields.
placeholder
Gold holds steady below $4,150 amid elevated US yields Gold price (XAU/USD) trades on a flat note near $4,140 during the early Asian session on Tuesday. Pressure from a stronger US Dollar (USD) and elevated US Treasury yields was offset by reduced expectations of a Federal Reserve (Fed) rate hike this month.
Author  FXStreet
Oct 06, Tue
Gold price (XAU/USD) trades on a flat note near $4,140 during the early Asian session on Tuesday. Pressure from a stronger US Dollar (USD) and elevated US Treasury yields was offset by reduced expectations of a Federal Reserve (Fed) rate hike this month.
placeholder
WTI rises to near $89.50 as Middle East supply threats offset Persian Gulf recoveryWest Texas Intermediate (WTI) oil price extends its gains for the second successive day, trading around $89.50 per barrel during the Asian hours on Wednesday. Crude oil climbed as persistent risks to Middle East energy flows overshadowed signs of rising supply from the region.
Author  FXStreet
Oct 07, Wed
West Texas Intermediate (WTI) oil price extends its gains for the second successive day, trading around $89.50 per barrel during the Asian hours on Wednesday. Crude oil climbed as persistent risks to Middle East energy flows overshadowed signs of rising supply from the region.
placeholder
Gold falls to a two-month low as real yields bite — can $4,000 hold?Gold hit a two-month low on 7 October, with spot touching roughly $4,090 and COMEX December futures closing at $4,140.70, even as the New York Fed's one-year inflation expectation rose to 3.9% — its highest since May 2023. The paradox resolves through real yields: the 30-year Treasury yield reached 5.732% intraday, its highest since 2002. Here are the levels, the institutional split, and the scenarios into tonight's jobless claims and 30-year auction.
Author  Irene Q.
16 hours ago
Gold hit a two-month low on 7 October, with spot touching roughly $4,090 and COMEX December futures closing at $4,140.70, even as the New York Fed's one-year inflation expectation rose to 3.9% — its highest since May 2023. The paradox resolves through real yields: the 30-year Treasury yield reached 5.732% intraday, its highest since 2002. Here are the levels, the institutional split, and the scenarios into tonight's jobless claims and 30-year auction.
Related Instrument
goTop
quote