

Ethereum Bulls Defend Support – Key Indicator Hints At Short-Term Rally

Source Newsbtc

Ethereum is trading near a crucial support zone as the entire crypto market undergoes a retracement phase. After days of bullish momentum, ETH now hovers around the $2,550 level—a line that could determine the short-term trajectory. Despite the pullback, Ethereum remains relatively strong compared to other assets, showing signs that bulls still maintain control of the structure.

However, risks are rising. If Ethereum loses this key demand zone, bearish pressure could intensify and trigger further downside across the altcoin market. Investors are watching closely as ETH tries to stabilize after multiple attempts to reclaim higher levels in recent weeks.

Top analyst Ali Martinez shared a technical signal that could offer hope for bulls. According to Martinez, if ETH manages to hold above $2,550, the TD Sequential indicator on the 4-hour chart is flashing a buy signal, pointing to a potential rebound toward $2,650. This aligns with the idea that consolidation near strong demand often leads to upside continuation if momentum holds.

Ethereum Builds Strength Amid Uncertainty

Ethereum is holding up well despite widespread market volatility, trading confidently above the $2,400 level. The asset continues to show strength as it consolidates within a key demand zone, positioning itself for a potential move higher. This resilience is drawing the attention of analysts, many of whom believe ETH is preparing for an impulsive breakout that could ignite a broader altseason.

While the technical outlook remains constructive, global tensions continue to shape investor sentiment. The ongoing trade friction between the US and China, combined with rising US Treasury yields, is injecting uncertainty into the macroeconomic landscape. These systemic risks have the potential to disrupt financial markets, but so far, cryptocurrencies—especially Bitcoin and Ethereum—have remained relatively firm.

Martinez shared a technical setup that could validate the bullish thesis. According to Martinez, Ethereum is flashing a TD Sequential buy signal on the 4-hour chart, signaling a likely rebound if ETH continues to hold above $2,550. This would position the asset for a move toward $2,650—a level that could confirm bullish momentum and bring altcoins back into focus.

Ethereum TD Sequential flashing a buy signal on the 4-hour chart | Source: Ali Martinez on X

If Ethereum can maintain its current support and break through immediate resistance, it could serve as a spark for renewed optimism across the crypto sector.

Bulls Face Key Support After Breakdown Below $2,550

Ethereum is under pressure as it drops below the $2,550 support level, now trading around $2,493. On the 4-hour chart, ETH has clearly lost momentum, slipping below the 34 EMA ($2,608) and also breaking beneath the 50 and 100 SMAs—levels that previously acted as support during consolidation. The recent rejection from the $2,800 range triggered a sharp correction, with increasing volume suggesting strong selling activity.
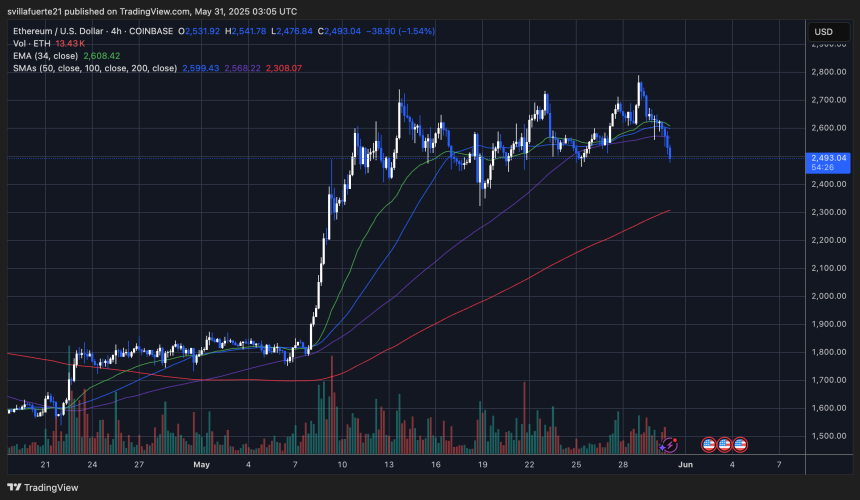
ETH testing key demand zone | Source: ETHUSDT chart on TradingView

The next key area to watch is around $2,450, which aligns with previous consolidation zones and could serve as short-term support. If this level fails to hold, ETH could retest the 200 SMA near $2,300, a crucial level that also lines up with early May breakout levels.

Despite the pullback, Ethereum remains within a broader uptrend. A reclaim of the $2,550–$2,600 zone could restore bullish momentum and set the stage for another attempt at the $2,700–$2,800 resistance range. The TD Sequential buy signal, previously active above $2,550, has now been invalidated, signaling caution for traders. All eyes are now on the bulls to see if they can defend this region and reset the short-term structure for a rebound.

Featured image from Dall-E, chart from TradingView

Disclaimer: For information purposes only. Past performance is not indicative of future results.
placeholder
US dollar clings to nine-week lows near 98.4 as Brent nears $100 and the yen hits a seven-month high — five events to watch todayThe dollar is pinned near nine-week lows even after a blockbuster jobs report, as an oil spike toward $100, a surging yen and China's reflation data crowd the driver's seat. Five key events to watch today: Brent at $99.46, USD/JPY at 154, China CPI/PPI, PBOC gold buying, and Thursday's PPI / Friday's CPI ahead of the September 15-16 FOMC.
Author  Eric Nkando
Sep 09, Wed
The dollar is pinned near nine-week lows even after a blockbuster jobs report, as an oil spike toward $100, a surging yen and China's reflation data crowd the driver's seat. Five key events to watch today: Brent at $99.46, USD/JPY at 154, China CPI/PPI, PBOC gold buying, and Thursday's PPI / Friday's CPI ahead of the September 15-16 FOMC.
placeholder
US August CPI lands tonight: after a 5.4% PPI shock, will the Fed hike on September 16?US August PPI came in at 5.4% year-on-year, above the 5.3% consensus, with core PPI at 4.6%. Traders have pushed the odds of a 25bp Fed hike on September 15-16 to around 70%. Tonight's CPI is the last major inflation print before the decision — here is the full calendar, the consensus numbers, and what a hot versus cool reading would mean for the dollar, yields, gold and stocks.
Author  Irene Q.
Sep 11, Fri
US August PPI came in at 5.4% year-on-year, above the 5.3% consensus, with core PPI at 4.6%. Traders have pushed the odds of a 25bp Fed hike on September 15-16 to around 70%. Tonight's CPI is the last major inflation print before the decision — here is the full calendar, the consensus numbers, and what a hot versus cool reading would mean for the dollar, yields, gold and stocks.
placeholder
Brent tests $108 as a key export pipeline stays shut — can the rally clear $110?Brent crude rose 2.55% to $106.97 and WTI 2.32% to $102.30 as a major regional export pipeline remained offline with no restart timeline. Front-month backwardation has widened to $5.53 from $3.84 a week ago, European gas is at its highest since December 2022, and one analyst sees $119.48 if talks stall.
Author  Irene Q.
20 hours ago
Brent crude rose 2.55% to $106.97 and WTI 2.32% to $102.30 as a major regional export pipeline remained offline with no restart timeline. Front-month backwardation has widened to $5.53 from $3.84 a week ago, European gas is at its highest since December 2022, and one analyst sees $119.48 if talks stall.
placeholder
Fed hike odds near 90% into Wednesday's decision — how to trade the dollar, gold and the S&P 500A 0.3% monthly core CPI print has lifted the market-implied probability of a 25bp Fed hike on 16 September to roughly 86.5% ~ 90%, which would be the first increase since July 2023. Here is the decision timeline, the pricing versus the forecasts, both scenarios, and the key levels for the dollar, gold and the S&P 500.
Author  Suzie
19 hours ago
A 0.3% monthly core CPI print has lifted the market-implied probability of a 25bp Fed hike on 16 September to roughly 86.5% ~ 90%, which would be the first increase since July 2023. Here is the decision timeline, the pricing versus the forecasts, both scenarios, and the key levels for the dollar, gold and the S&P 500.
placeholder
Silver Price Forecast: XAG/USD falls to near $63.50 amid Fed hike bets, higher oil pricesSilver price (XAG/USD) loses its gains from the previous day, trading around $63.50 per troy ounce during Asian hours on Monday. Non-yielding Silver is currently facing significant headwinds driven by rising Federal Reserve (Fed) rate-hike expectations for the upcoming September decision.
Author  FXStreet
16 hours ago
Silver price (XAG/USD) loses its gains from the previous day, trading around $63.50 per troy ounce during Asian hours on Monday. Non-yielding Silver is currently facing significant headwinds driven by rising Federal Reserve (Fed) rate-hike expectations for the upcoming September decision.
goTop
quote