

Bitcoin Price Could Be Preparing For Fresh Wave Of Volatility — Here’s Why

Source Newsbtc

The Bitcoin price action over the weekend has been quite sluggish, reflecting the indecision and fatigue seemingly hovering over the cryptocurrency market at the moment. After a dour performance during the week, the premier cryptocurrency has continued to trade within the $92,000 – $95,000 range on Saturday, May 17.

With the choppy price action, doubt about the Bitcoin price reclaiming its all-time high of $108,786 is starting to creep in. However, the latest on-chain data suggests that the market leader could be gearing up for significant price movements over the next few weeks.

Open Interest Metric Predicts What’s Next For BTC Price

In a recent post on the X platform, blockchain analytics firm Alphractal delved into fresh on-chain observations revolving around the price of Bitcoin and the open interest (OI) cycle. According to the market intelligence firm, the BTC open interest data is exhibiting certain patterns that have coincided with major price moves in the past. 

Typically, the open interest metric measures the total amount of money flowing into BTC derivatives at any given period. Meanwhile, the OI Delta indicator estimates changes in the open interest over a specific timeframe.
Bitcoin price

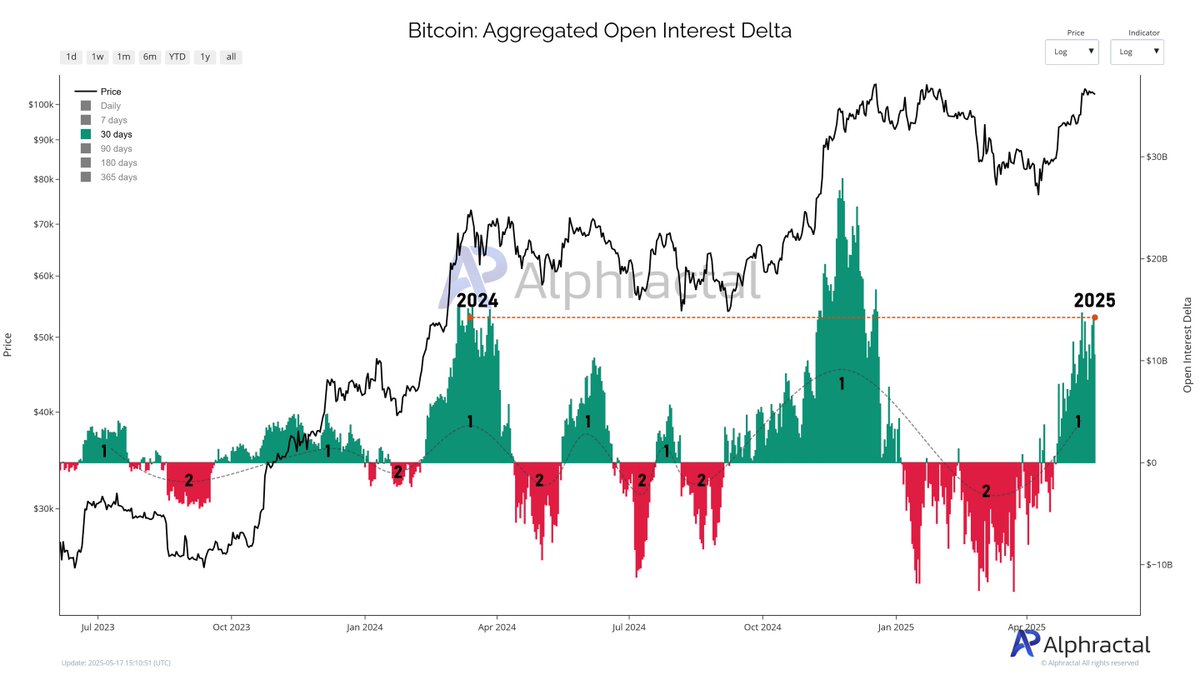
Firstly, Alphractal highlighted that the 30-day Open Interest Delta recently reached the same levels seen during the Bitcoin price rise to its previous all-time high around $73,737 in 2024. This pattern shows that the BTC market could be at the beginning of a cyclical behavioral change.

Alphractal said: 

A familiar pattern is emerging: alternating cycles of increase and decrease in the Open Interest Delta — what we might call Phase 1 and Phase 2. After a strong buildup of positions (positive Delta), we often see a nearly proportional drop (negative Delta), showing clear cyclical behavior in the market.

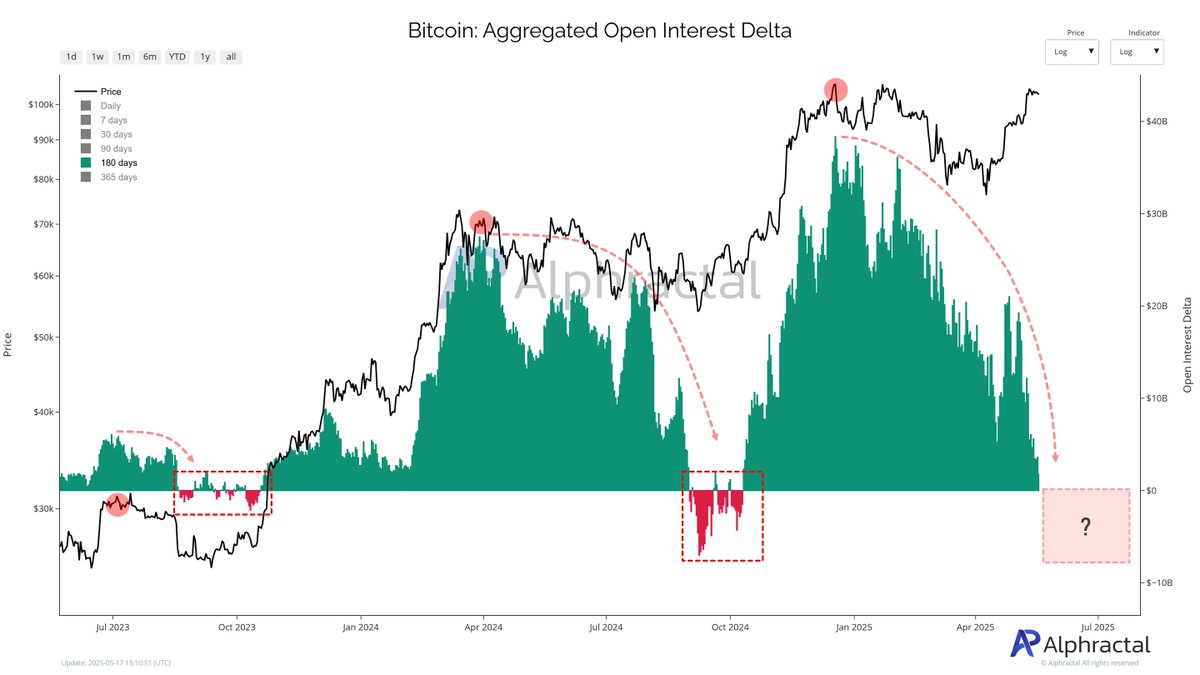
Furthermore, Alphractal noted that the 180-day Open Interest Delta offers a more interesting insight into the Bitcoin price trajectory in the coming weeks. According to the market intelligence firm, a negative 180-day OI Delta metric is usually associated with a market bottom or an accumulation trend.
Bitcoin price

As shown in the chart above, the 180-day Open Interest Delta sits just above the negative territory, which suggests that the Bitcoin price could witness increased volatility in the coming weeks. However, it is worth mentioning that a cross beneath the zero threshold could also signal the start of a new consolidation phase.

Alphractal concluded on X:

Overall, Open Interest has not grown proportionally like it did from October 2023 to early 2024 — and again from October 2024 into early 2025. These yearly patterns may suggest a fractal behavior in investor risk appetite.

Bitcoin Price At A Glance

As of this writing, the price of BTC stands at around $103,367, reflecting a 0.4% decline in the past 24 hours.

Bitcoin price Featured image from iStock, chart from TradingView
Disclaimer: For information purposes only. Past performance is not indicative of future results.
placeholder
WTI Price Forecast: Dips to $91.50 as Middle East jitters limit lossesWest Texas Intermediate (WTI) – the benchmark US Crude Oil price – attracts some sellers during the Asian session on Friday, snapping a two-day winning streak and stalling the previous day's recovery from the vicinity of a nearly four-week low.
Author  FXStreet
Oct 02, Fri
West Texas Intermediate (WTI) – the benchmark US Crude Oil price – attracts some sellers during the Asian session on Friday, snapping a two-day winning streak and stalling the previous day's recovery from the vicinity of a nearly four-week low.
placeholder
Silver price forecast: XAG/USD rises to near $61.40 as US yields retreat, NFP eyedSilver price (XAG/USD) is up 0.55% to near $61.38 during the late Asian trading session on Friday. The white metal edges up as rally in United States (US) Treasury Yields has hit a pause.
Author  FXStreet
Oct 02, Fri
Silver price (XAG/USD) is up 0.55% to near $61.38 during the late Asian trading session on Friday. The white metal edges up as rally in United States (US) Treasury Yields has hit a pause.
placeholder
United States Dollar Index sits near March 2025 highs, above 102.00 ahead of US NFPThe US Dollar Index (DXY), which tracks the Greenback against a basket of currencies, attracts buyers for the fifth straight day and climbs back above the 102.00 mark during the Asian session on Friday.
Author  FXStreet
Oct 02, Fri
The US Dollar Index (DXY), which tracks the Greenback against a basket of currencies, attracts buyers for the fifth straight day and climbs back above the 102.00 mark during the Asian session on Friday.
placeholder
US September Nonfarm Payrolls Preview: Job Growth May Cool, How Will US Stocks, Dollar and Gold React?On Friday, October 2 (EDT), the U.S. will release its September nonfarm payrolls report, with markets focusing on whether job growth can sustain August's rebound and whether the data will
Author  TradingKey
Oct 01, Thu
On Friday, October 2 (EDT), the U.S. will release its September nonfarm payrolls report, with markets focusing on whether job growth can sustain August's rebound and whether the data will
placeholder
Gold falls to near $4,150 as higher Treasury yields, oil prices outweigh softer PCE inflationGold price (XAU/USD) tumbles to near $4,150 during the early Asian session on Thursday, pressured by elevated US Treasury bond yields. Traders await the US September employment data for fresh impetus, which will be released later on Friday. 
Author  FXStreet
Oct 01, Thu
Gold price (XAU/USD) tumbles to near $4,150 during the early Asian session on Thursday, pressured by elevated US Treasury bond yields. Traders await the US September employment data for fresh impetus, which will be released later on Friday. 
goTop
quote