


Dow Jones Industrial Average falls over 1,000 points as Anthropic IPO dominates
- DJIA falls over 1,000 points and below 50,000, its lowest in over four months.
- AI stocks gave up their gains as Anthropic shares began trading 34% higher.
- Michigan consumer sentiment and monthly options expiry are both due Friday.
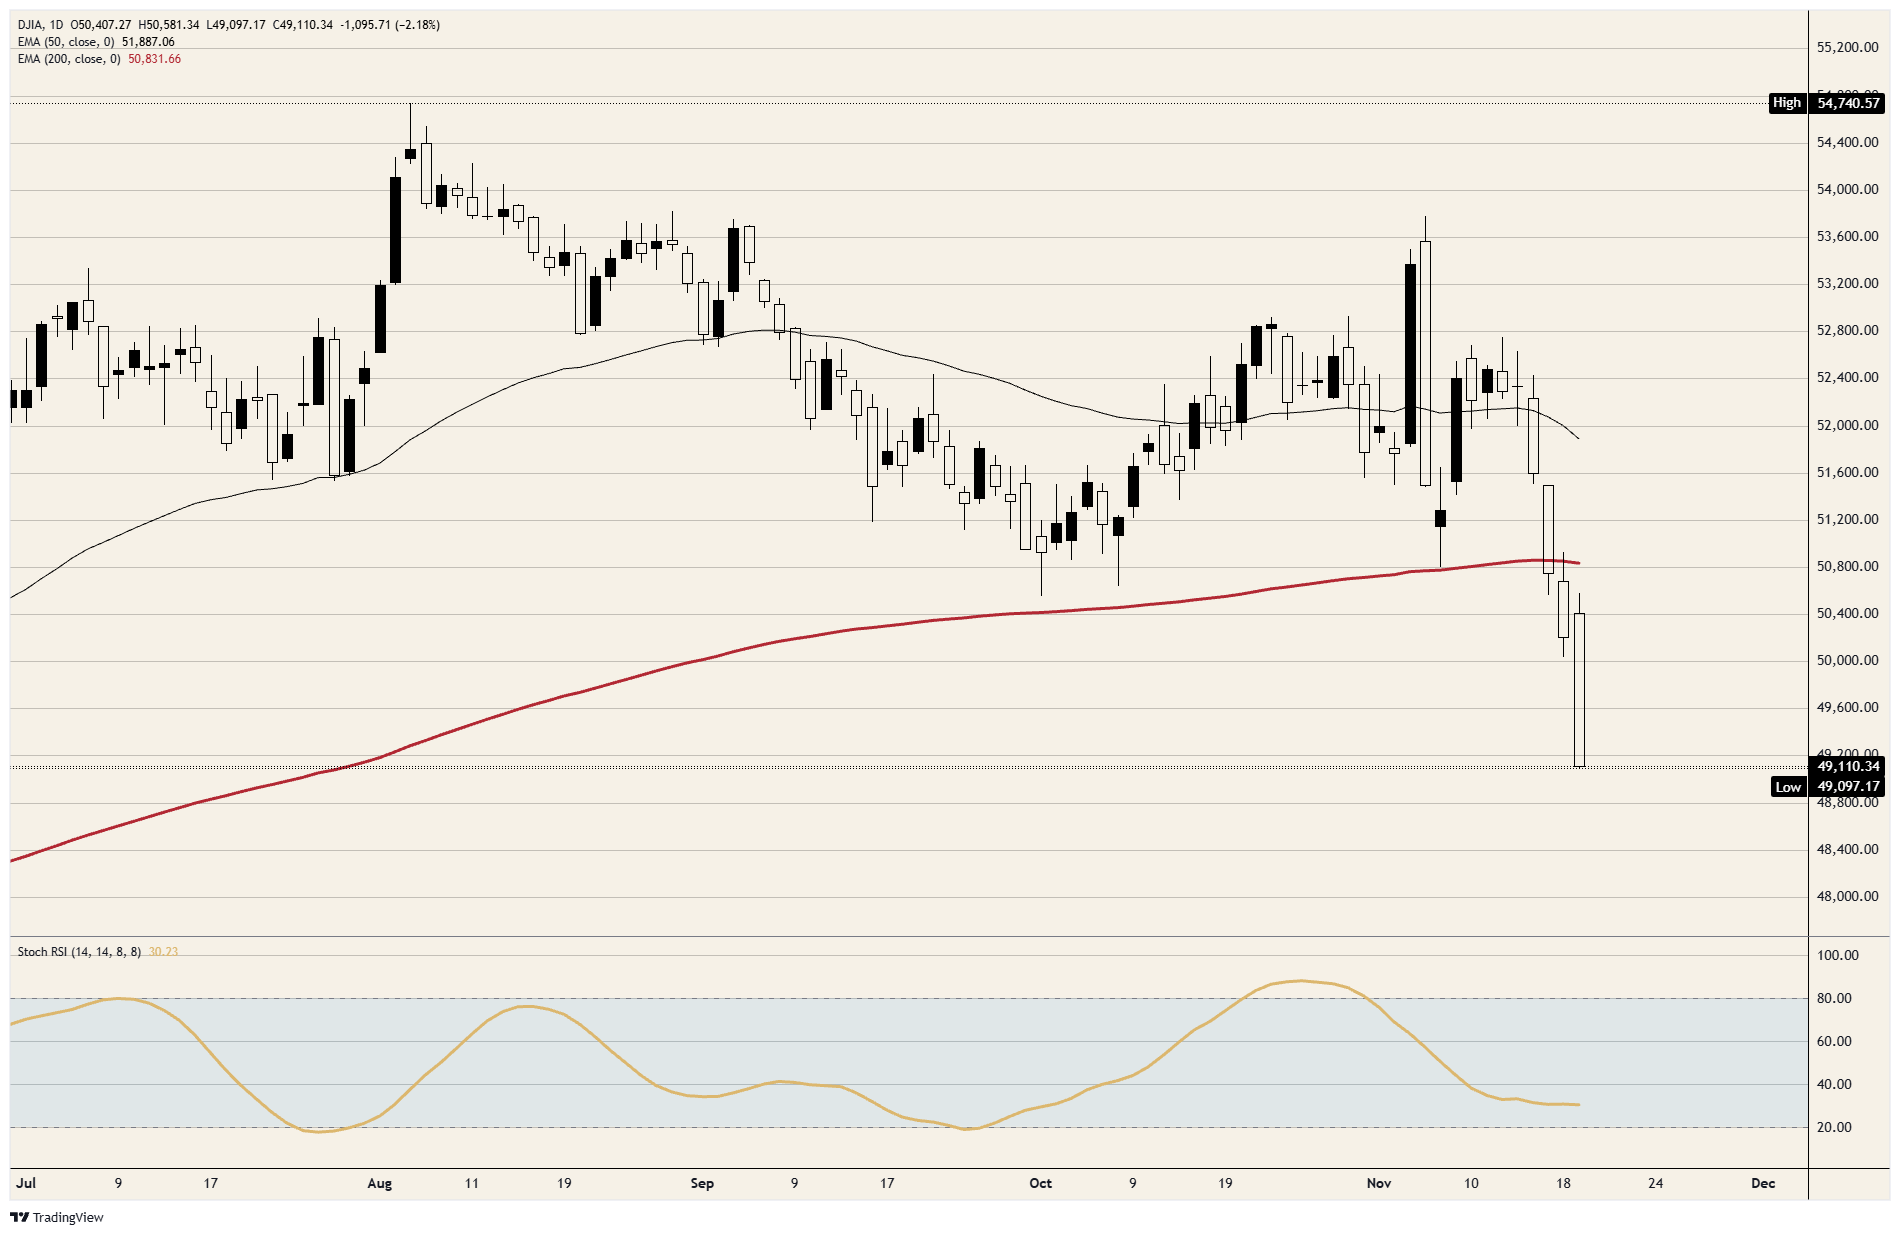
US stocks rallied into the biggest initial public offering (IPO) on record and have fallen since the moment its shares began trading. The Dow Jones Industrial Average is down more than 1,000 points near 49,100, below 50,000 for the first time in more than four months. The S&P 500 is near 7,175, and the Nasdaq 100 has dropped about 1,250 points from its session high to near 26,500.
Anthropic (ANT) priced at $83 on Wednesday, above its $70-$78 range, and raised about $81 billion, the most on record. Its first trade on the Nasdaq was at $111.50, 34% higher, and all three indexes fell to new session lows within minutes as artificial intelligence (AI) stocks gave up their gains. The shares are trading near $97, still 17% above the IPO price, and none of that gain counts toward indexes that don't include the stock.
Nvidia (NVDA), down 27% in November, the month Chief Executive Jensen Huang resigned, lost its gain along with Microsoft (MSFT), and both are in all three indexes. Advanced Micro Devices (AMD) fell more than 7% after Hunterbrook Capital disclosed a short position and alleged breaches of US export controls involving China. UnitedHealth (UNH), down more than 5% and almost 19% since Friday's close, took points off the price-weighted Dow Jones Industrial Average that have nothing to do with AI.
On the calendar
The University of Michigan's final consumer sentiment reading for November is due at 15:00 GMT on Friday. Monthly stock and index options expire the same day, with all three indexes at their lows for the month, and Anthropic gets its first full session of trading.
Traders have fully priced a quarter-point Fed hike from 3.75%-4.00% at the December 8-9 meeting. Chicago Fed President Goolsbee said on Thursday that inflation isn't on a path back to 2%, and that AI wealth and data centre demand are adding to it.
On the charts
The Dow Jones Industrial Average has lost about 3,000 points since November 13 and went through its 200-day Exponential Moving Average (EMA) near 50,800 on Tuesday. It's now more than 10% below its August high near 54,750. The S&P 500 began the session above its 200-day EMA near 7,350 and is about 175 points below it, while the Nasdaq 100 is below its early-November low near 26,600 and about 15% below its October high.
Dow Jones daily chart
Dow Jones FAQs
The Dow Jones Industrial Average, one of the oldest stock market indices in the world, is compiled of the 30 most traded stocks in the US. The index is price-weighted rather than weighted by capitalization. It is calculated by summing the prices of the constituent stocks and dividing them by a factor, currently 0.152. The index was founded by Charles Dow, who also founded the Wall Street Journal. In later years it has been criticized for not being broadly representative enough because it only tracks 30 conglomerates, unlike broader indices such as the S&P 500.
Many different factors drive the Dow Jones Industrial Average (DJIA). The aggregate performance of the component companies revealed in quarterly company earnings reports is the main one. US and global macroeconomic data also contributes as it impacts on investor sentiment. The level of interest rates, set by the Federal Reserve (Fed), also influences the DJIA as it affects the cost of credit, on which many corporations are heavily reliant. Therefore, inflation can be a major driver as well as other metrics which impact the Fed decisions.
Dow Theory is a method for identifying the primary trend of the stock market developed by Charles Dow. A key step is to compare the direction of the Dow Jones Industrial Average (DJIA) and the Dow Jones Transportation Average (DJTA) and only follow trends where both are moving in the same direction. Volume is a confirmatory criteria. The theory uses elements of peak and trough analysis. Dow’s theory posits three trend phases: accumulation, when smart money starts buying or selling; public participation, when the wider public joins in; and distribution, when the smart money exits.
There are a number of ways to trade the DJIA. One is to use ETFs which allow investors to trade the DJIA as a single security, rather than having to buy shares in all 30 constituent companies. A leading example is the SPDR Dow Jones Industrial Average ETF (DIA). DJIA futures contracts enable traders to speculate on the future value of the index and Options provide the right, but not the obligation, to buy or sell the index at a predetermined price in the future. Mutual funds enable investors to buy a share of a diversified portfolio of DJIA stocks thus providing exposure to the overall index.
Recommended Articles


