

Bitcoin hits $100,000 again, what’s driving the surge
- Bitcoin crosses the $100,000 milestone early on Monday for the first time in 2025.
- The move above the key level is likely driven by the return of institutional interest and rising BTC accumulation.
- Bitcoin supply on exchanges shrinks, a bullish indicator for BTC price in the short term.
Bitcoin (BTC) breaks the $100,000 level for the first time in 2025 on Monday, rallies to $101,184. Bitcoin’s price rally is likely powered by a nearly 100% increase in options trade volume in the past 24 hours, according to Coinglass data.
President-elect Donald Trump’s inauguration ceremony is two weeks away, and traders are anticipating pro-crypto regulation and policy during Trump’s Presidency.
Two key market movers driving the recent Bitcoin gains are the return of institutional capital inflow and a dwindling exchange supply of BTC.
Bitcoin rallies to $100,000 riding on these two catalysts
Bitcoin observed a decline in interest from institutional investors in the last two weeks of December. However, Farside Investors’ data on Spot Bitcoin Exchange Traded Fund (ETF) flows shows a streak of outflows for several consecutive days before institutional interest in BTC reignited in early January.
On Friday, Bitcoin recorded $908.1 million in net inflows across its US-based Spot ETFs, the largest inflow volume recorded since mid-December 2024. Typically, this can be interpreted as a return of institutional investor interest in the largest cryptocurrency by market capitalization.
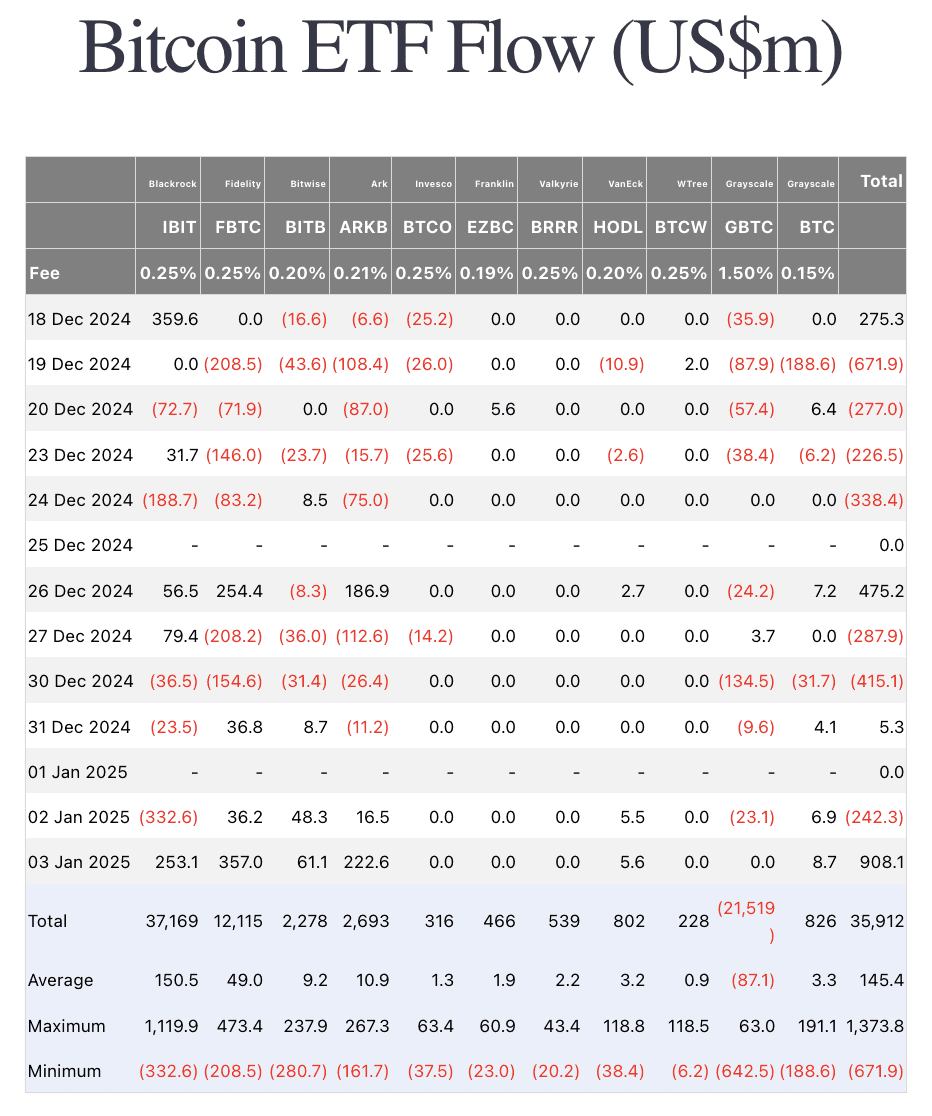
Bitcoin ETF Flows | Source: Farside Investors
Data from on-chain intelligence tracker Santiment shows an increase in BTC tokens held off exchanges and a decrease in BTC supply on exchange platforms. There has been a clear divergence between the two metrics since mid-November, indicating BTC accumulation off-exchange platforms and a reduction in selling pressure on exchanges.
The two metrics support a bullish thesis for additional gains in Bitcoin in the short term.
 [12.12.08, 06 Jan, 2025]-638717472845690924.png)
Bitcoin supply outside of exchanges and on exchanges | Source: Santiment
Analysts at 10X Research highlighted the significance of declining Bitcoin supply on exchanges in the report titled “Our Bitcoin/Crypto Game Plan for January,” published on Monday. Analysts observe that “...only three platforms currently hold more than 150,000 Bitcoins. Coinbase leads with 717,000 Bitcoins, despite a 30-day outflow of 48,000. Binance follows with 572,000 and an outflow of 6,500, and Bitfinex follows with 361,000, which saw outflows of 27,000.”
The team of researchers led by Markus Thielen considers significant exchange withdrawals of BTC as a signal that holders do not intend to sell, typically a bullish indicator for BTC. The report reads:
“This trend also raises the argument that exchanges gradually run out of Bitcoin. At the same time, over-the-counter (OTC) desk holdings remain at historically low levels, further tightening supply - which is bullish.”
Market movers influencing Bitcoin price this cycle
The world’s largest digital currency witnessed a massive increase in its price following Donald Trump’s win in the 2024 US Presidential election. The consecutive appointment of pro-crypto candidates as Chair of the Securities and Exchange Commission (SEC) and the Artificial Intelligence (AI) and Crypto Czar were other key factors that fueled a positive sentiment among traders.
The new US administration is expected to embrace crypto, a complete reversal from SEC Chair Gary Gensler’s “war on crypto” narrative. These are the other factors contributing to the rise in Bitcoin and crypto prices in 2025.
Where is Bitcoin price headed
Bitcoin price could retest resistance at $102,800, the lower boundary of the imbalance zone on the BTC/USDT daily price chart. Once BTC successfully flips the resistance into support, it could rally toward the all-time high at $108,353.
BTC hits the $100,000 milestone for the first time in 2025 on Monday, signaling confidence among investors. On the downside, the daily price chart shows a support zone between $95,151 and $96,100, and Bitcoin could test these levels in the event of a correction.
Two key technical indicators, the Relative Strength Index (RSI) and Moving Average Convergence Divergence (MACD), further support Bitcoin’s recent gains.
RSI reads 56 and is sloping upwards, while the MACD flashes green histogram bars above the neutral line, meaning there is underlying positive momentum in the Bitcoin price trend.
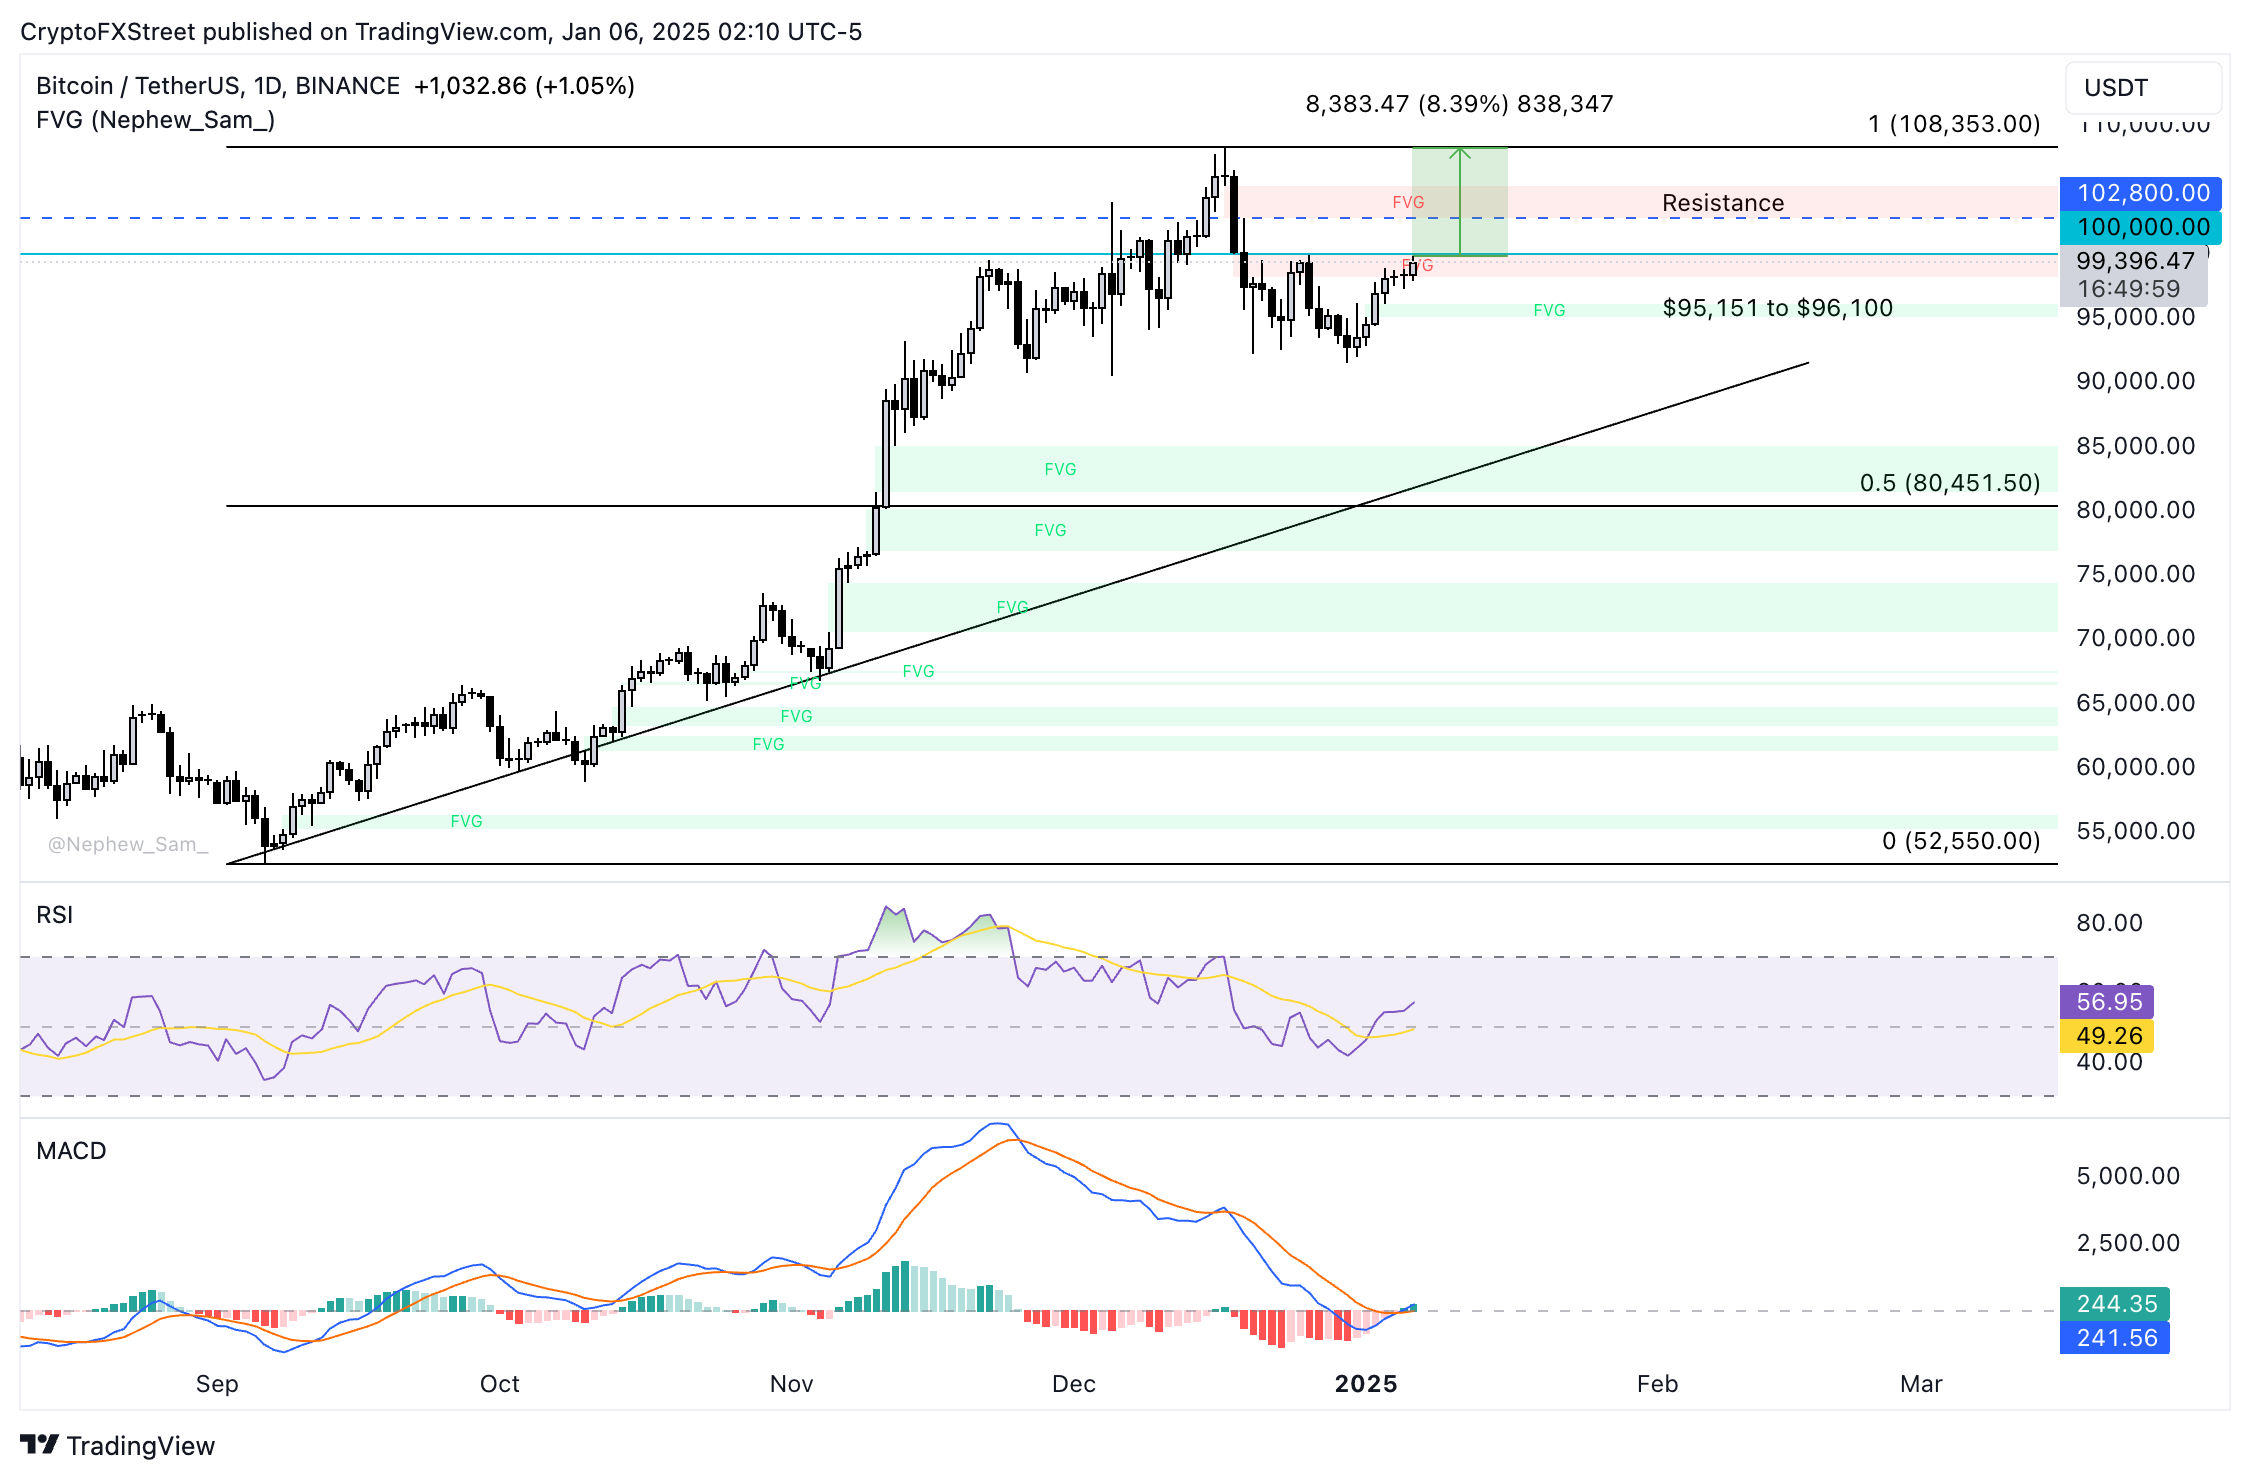
BTC/USDT daily price chart
A daily candlestick close below the December 27 high of $97,544 could invalidate the bullish thesis for BTC, sending the token to test the support zone between $95,151 and $96,100.
Recommended Articles


