

Coinbase Premium Index Reaches Two-Year Low At -0.23%: Impact On Bitcoin Price Unveiled

Source Newsbtc

In a promising development, the Bitcoin price is inching closer to the coveted $100,000 mark as it trades above $98,000 for the first time since late December. 

Crypto analyst Ali Martinez has highlighted several critical metrics that could signal further bullish momentum for the leading cryptocurrency as the market begins to recover.

Bitcoin Price Surges Amid Coinbase Premium Index Low

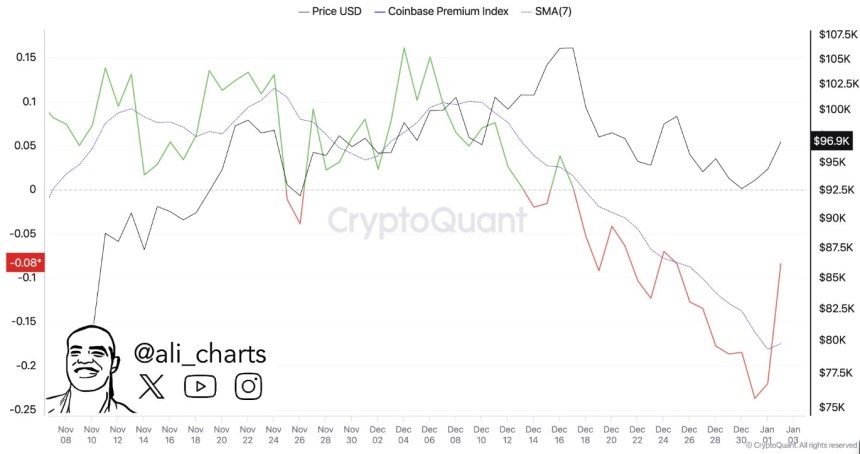
One of the significant indicators discussed by Martinez is the Coinbase Premium Index, which recently hit -0.23%, its lowest point in two years. This index measures the price difference between Bitcoin on Coinbase and other exchanges. 

A negative premium suggests that US-based investors may be less willing to pay a premium for Bitcoin, but the current rebound could indicate a shift toward growing institutional interest in the asset.
Bitcoin

Martinez also noted that the recent uptick in the Bitcoin price comes amid a notable withdrawal trend, with over 48,000 BTC—valued at more than $4.5 billion—pulled from exchanges in the past week. This trend indicates a bullish sentiment among investors, despite a brief price correction that occurred late last year.

Despite these positive signals, Martinez cautions that Bitcoin is at a crucial juncture. He emphasized the importance of sustaining a close above the 50-day moving average (MA), currently just above $96,000. 

A failure to maintain this level could lead to a potential downward correction. Conversely, a sustained close above the 50-day MA could signal the end of the recent correction and confirm a more robust bullish trend.

Strong Upward Move Expected After Wave Three Breakout

In addition to Martinez’s insights, the Elliot Wave Academy has provided a technical analysis of the recent Bitcoin price movements, suggesting that the cryptocurrency is currently in the fourth wave of a larger bullish cycle. 

The academy’s analysis indicates that after a powerful breakout from a price channel, Bitcoin has successfully surpassed the ideal level of wave three, which may signal a strong upward move. The fourth wave, according to their analysis, is characterized by a sideways pattern following the sharp rise of wave three. 

The potential correction zones for this wave have been identified, and should these levels be breached, the next upward wave could target a Bitcoin price range between $117,475.70 and $138,058.37. These figures represent major bullish targets that could attract further investment and drive Bitcoin’s price higher.

All around, as the Bitcoin price continues its upward trajectory, the combination of significant withdrawals from exchanges, a low Coinbase Premium Index, and positive Elliott Wave analysis paints a compelling picture for the cryptocurrency’s future. 

However, investors should remain vigilant, keeping an eye on critical price levels that could determine the market’s next move. 

Bitcoin

At the time of writing, the market’s leading crypto is trading at $98,320. 

Featured image from DALL-E, chart from TradingView.com 

Disclaimer: For information purposes only. Past performance is not indicative of future results.
placeholder
US dollar clings to nine-week lows near 98.4 as Brent nears $100 and the yen hits a seven-month high — five events to watch todayThe dollar is pinned near nine-week lows even after a blockbuster jobs report, as an oil spike toward $100, a surging yen and China's reflation data crowd the driver's seat. Five key events to watch today: Brent at $99.46, USD/JPY at 154, China CPI/PPI, PBOC gold buying, and Thursday's PPI / Friday's CPI ahead of the September 15-16 FOMC.
Author  Eric Nkando
Sep 09, Wed
The dollar is pinned near nine-week lows even after a blockbuster jobs report, as an oil spike toward $100, a surging yen and China's reflation data crowd the driver's seat. Five key events to watch today: Brent at $99.46, USD/JPY at 154, China CPI/PPI, PBOC gold buying, and Thursday's PPI / Friday's CPI ahead of the September 15-16 FOMC.
placeholder
US August CPI lands tonight: after a 5.4% PPI shock, will the Fed hike on September 16?US August PPI came in at 5.4% year-on-year, above the 5.3% consensus, with core PPI at 4.6%. Traders have pushed the odds of a 25bp Fed hike on September 15-16 to around 70%. Tonight's CPI is the last major inflation print before the decision — here is the full calendar, the consensus numbers, and what a hot versus cool reading would mean for the dollar, yields, gold and stocks.
Author  Irene Q.
Sep 11, Fri
US August PPI came in at 5.4% year-on-year, above the 5.3% consensus, with core PPI at 4.6%. Traders have pushed the odds of a 25bp Fed hike on September 15-16 to around 70%. Tonight's CPI is the last major inflation print before the decision — here is the full calendar, the consensus numbers, and what a hot versus cool reading would mean for the dollar, yields, gold and stocks.
placeholder
Brent tests $108 as a key export pipeline stays shut — can the rally clear $110?Brent crude rose 2.55% to $106.97 and WTI 2.32% to $102.30 as a major regional export pipeline remained offline with no restart timeline. Front-month backwardation has widened to $5.53 from $3.84 a week ago, European gas is at its highest since December 2022, and one analyst sees $119.48 if talks stall.
Author  Irene Q.
20 hours ago
Brent crude rose 2.55% to $106.97 and WTI 2.32% to $102.30 as a major regional export pipeline remained offline with no restart timeline. Front-month backwardation has widened to $5.53 from $3.84 a week ago, European gas is at its highest since December 2022, and one analyst sees $119.48 if talks stall.
placeholder
Fed hike odds near 90% into Wednesday's decision — how to trade the dollar, gold and the S&P 500A 0.3% monthly core CPI print has lifted the market-implied probability of a 25bp Fed hike on 16 September to roughly 86.5% ~ 90%, which would be the first increase since July 2023. Here is the decision timeline, the pricing versus the forecasts, both scenarios, and the key levels for the dollar, gold and the S&P 500.
Author  Suzie
19 hours ago
A 0.3% monthly core CPI print has lifted the market-implied probability of a 25bp Fed hike on 16 September to roughly 86.5% ~ 90%, which would be the first increase since July 2023. Here is the decision timeline, the pricing versus the forecasts, both scenarios, and the key levels for the dollar, gold and the S&P 500.
placeholder
Silver Price Forecast: XAG/USD falls to near $63.50 amid Fed hike bets, higher oil pricesSilver price (XAG/USD) loses its gains from the previous day, trading around $63.50 per troy ounce during Asian hours on Monday. Non-yielding Silver is currently facing significant headwinds driven by rising Federal Reserve (Fed) rate-hike expectations for the upcoming September decision.
Author  FXStreet
16 hours ago
Silver price (XAG/USD) loses its gains from the previous day, trading around $63.50 per troy ounce during Asian hours on Monday. Non-yielding Silver is currently facing significant headwinds driven by rising Federal Reserve (Fed) rate-hike expectations for the upcoming September decision.
goTop
quote