

Ethereum Price Forecast: ETH could attempt rally as exchange and ETF flows present mixed signals
Ethereum price today: $2,510
- Ethereum exchange reserve has plunged by 300,000 ETH, indicating bullish sentiment among on-chain traders.
- Ethereum ETFs paint an opposite view with $35 million in outflows.
- Ethereum could rally to $2,707 if prices cross above the 200-day, 100-day and 50-day SMAs convergence.
Ethereum (ETH) reclaimed the $2,500 psychological level, recording nearly a 1% gain on Monday. The top altcoin is showing signs of a potential rally following increased exchange withdrawal among investors. However, negative flows in Ethereum exchange-traded funds (ETF) could affect its price growth chances.
Ethereum's on-chain activity and ETF flows indicate mixed investor sentiment
Ethereum investors have withdrawn about 300,000 ETH, valued at approximately $760 million, from exchanges in the past week, according to CryptoQuant's data.
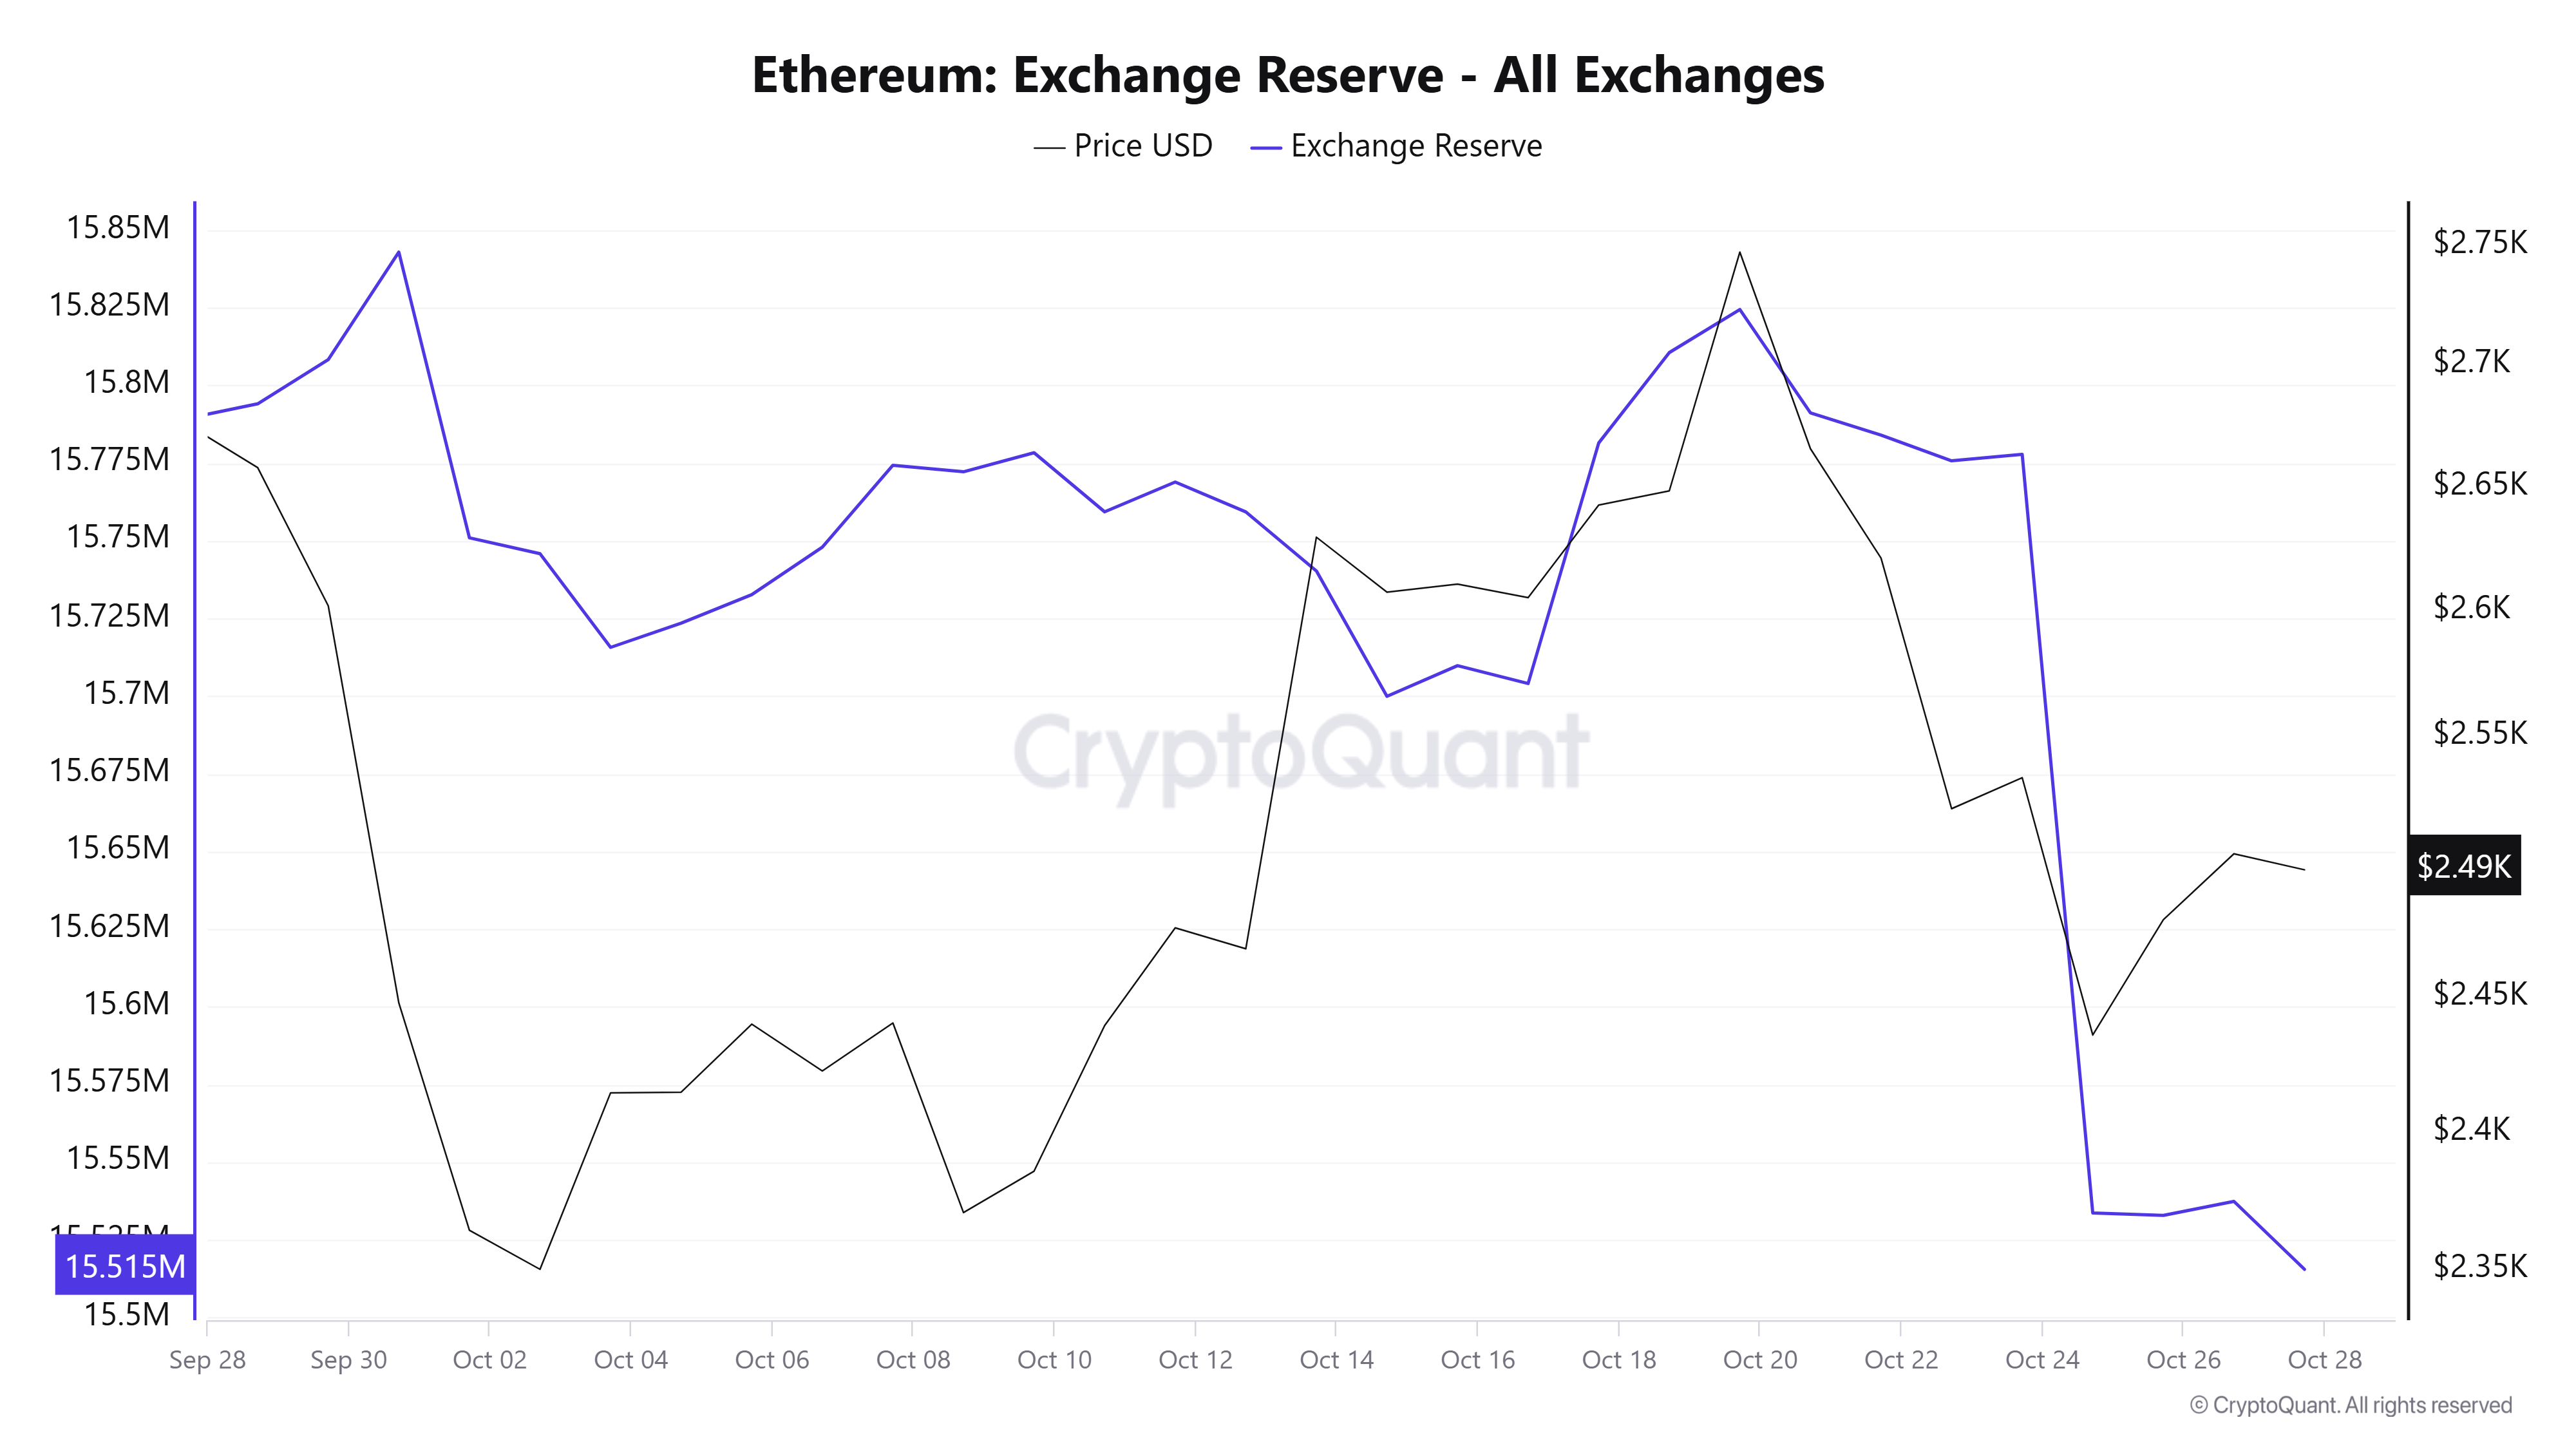
ETH Exchange Reserve (Source: CryptoQuant)
It appeared investors leveraged ETH's price decline last week as a buy-the-dip opportunity.
Most of these outflows potentially flowed into staking protocols as the total amount staked grew by nearly 130,000 ETH within the same period.
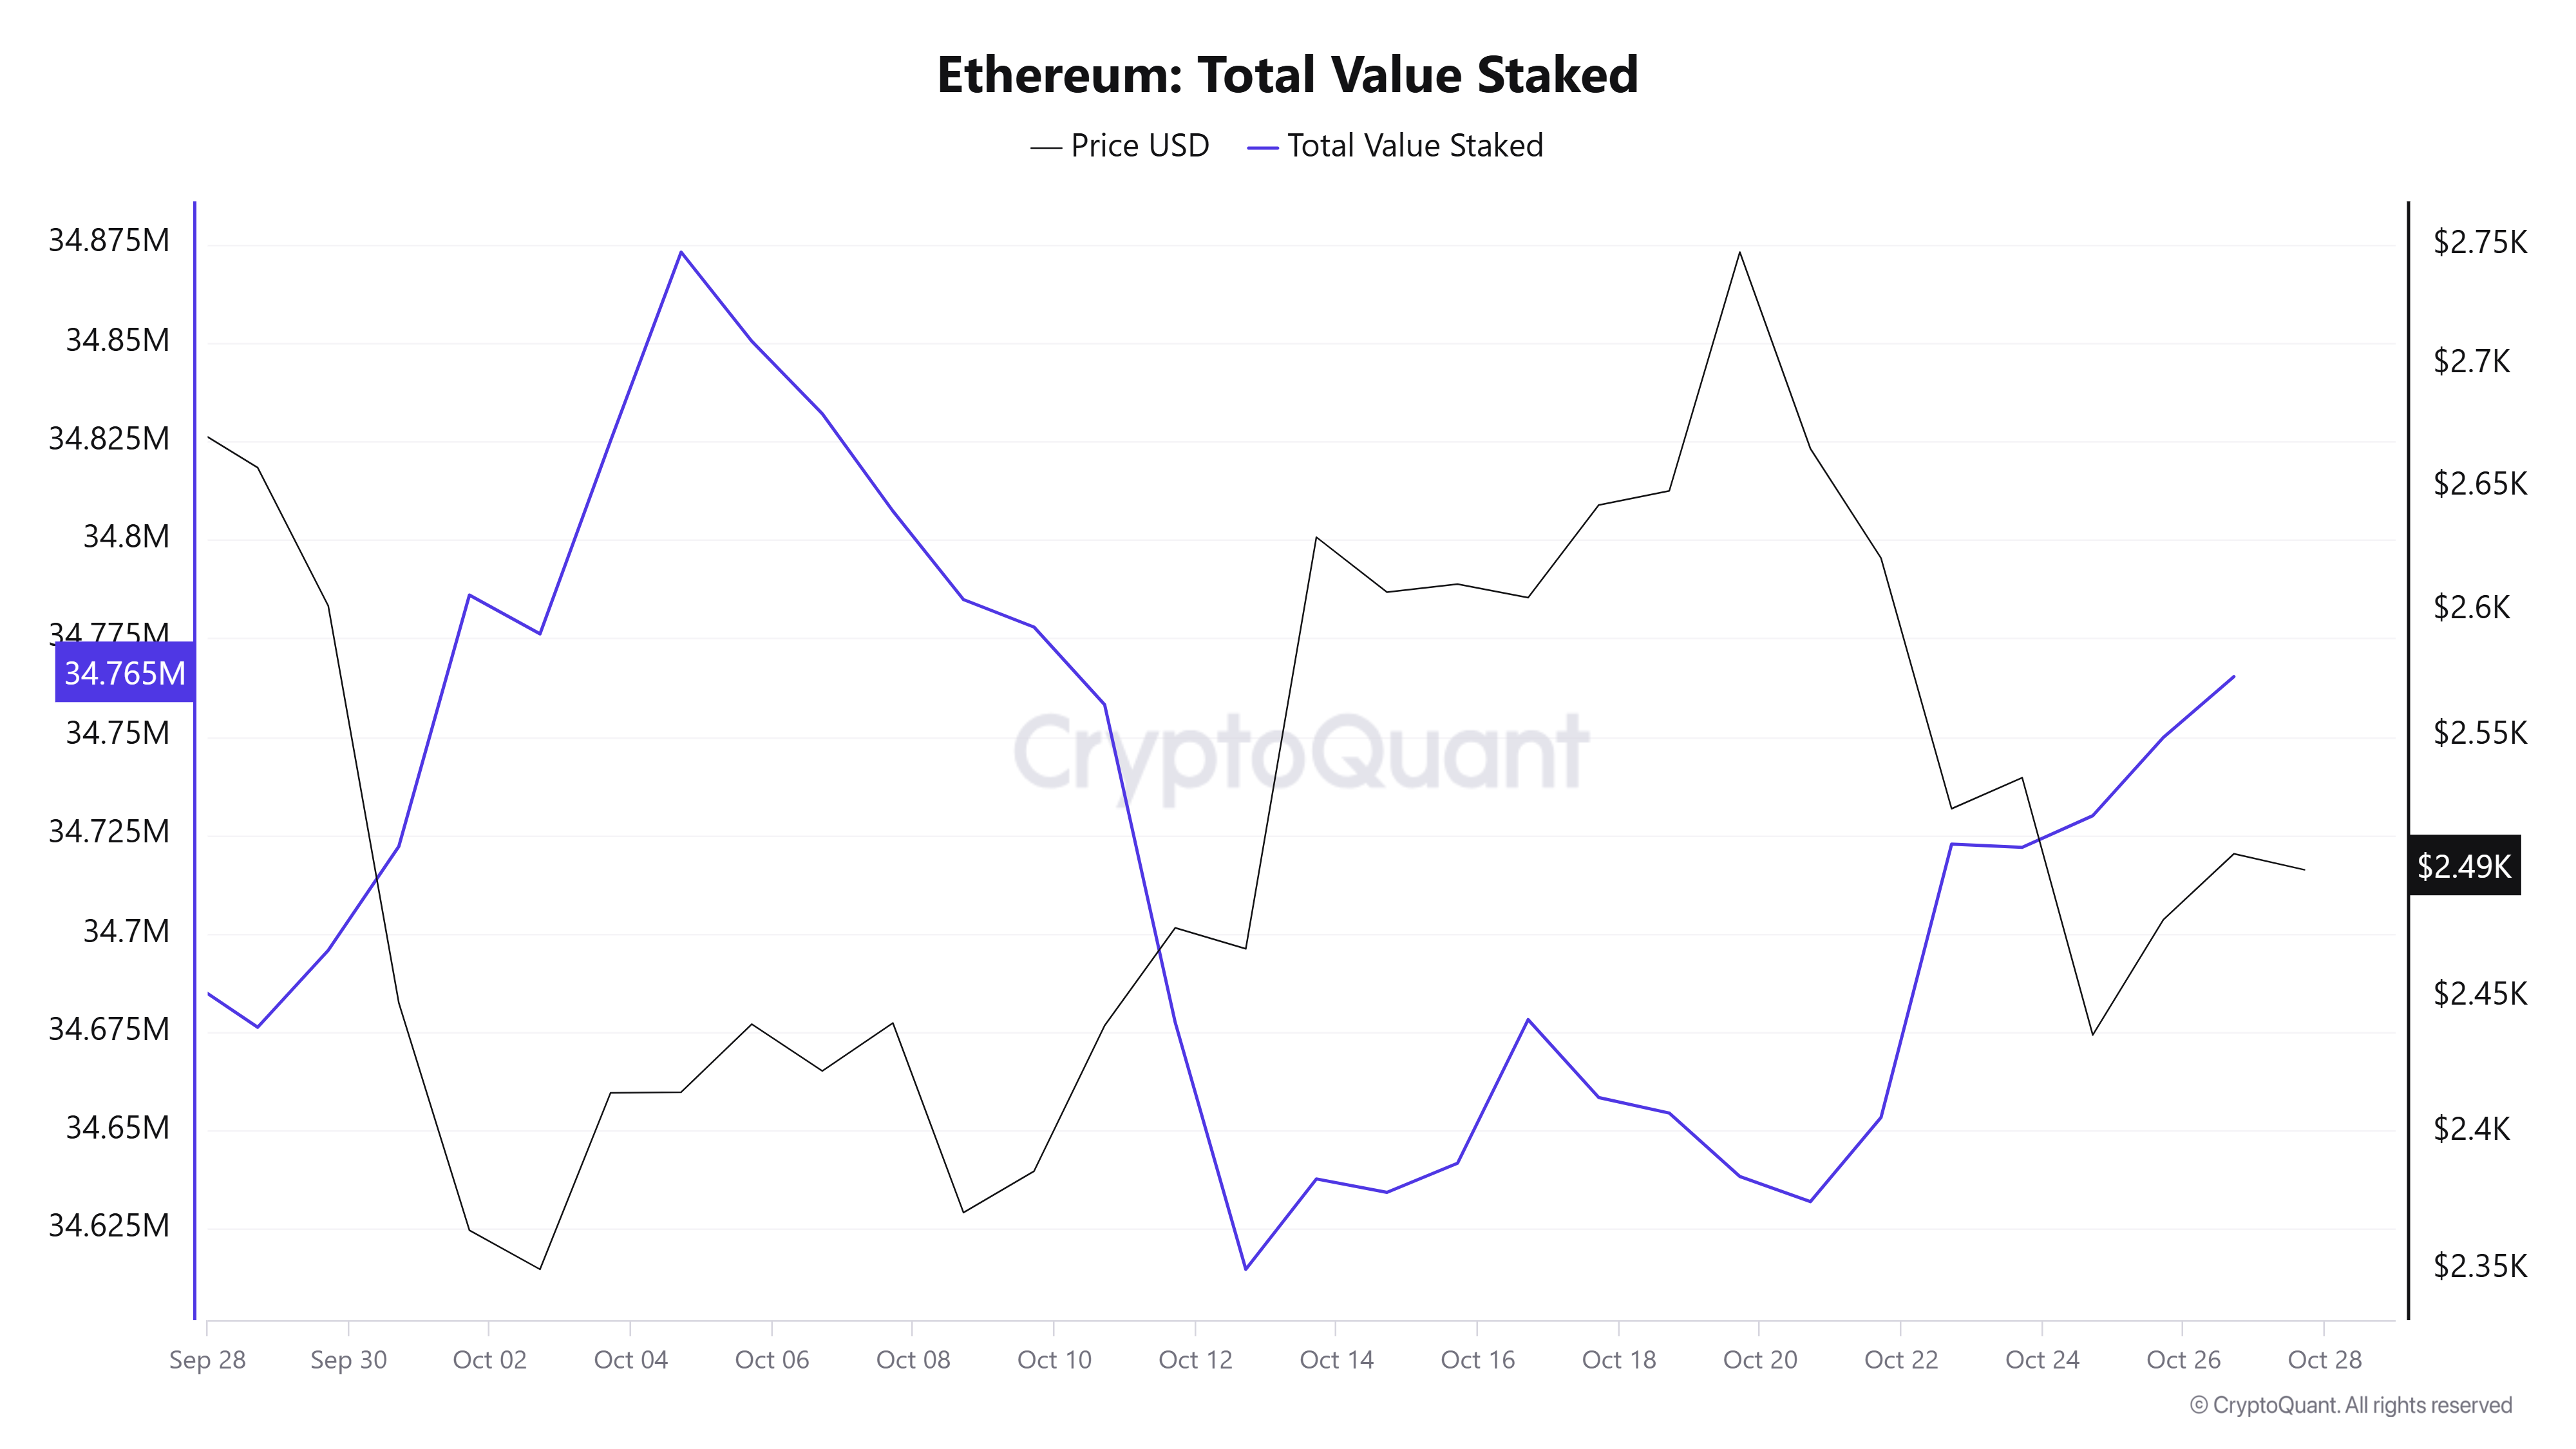
Total ETH Staked (Source: CryptoQuant)
While ETH's on-chain picture paints a bullish outlook, ETH ETF flows indicate that traditional investors do not share this notion.
Ethereum ETFs saw the largest outflow among digital assets last week, recording $35 million in negative flows, per CoinShares data. This is in stark contrast to Bitcoin and Solana ETFs, which posted net inflows of $920 million and $10.8 million last week, respectively.
Meanwhile, RD InnoTech, a participant of the Hong Kong Monetary Authority's Stablecoin Issuer Sandbox, plans to launch a Hong Kong Dollar Stablecoin (HKDR) on the Ethereum network, per Wu Blockchain.
Ethereum Price Forecast: ETH could tackle the $2,707 level if it crosses above SMA convergence
Ethereum is trading around $2,510, down 0.6% on the day, after sustaining $13.51 million in liquidations. Long and short liquidations accounted for $4.34 million and $9.17 million, respectively.
ETH is consolidating within a key rectangular channel with resistance at $2,594 and support at $2,395. The top altcoin is also attempting to cross above the convergence of its 200-day, 100-day and 50-day Simple Moving Averages (SMA).
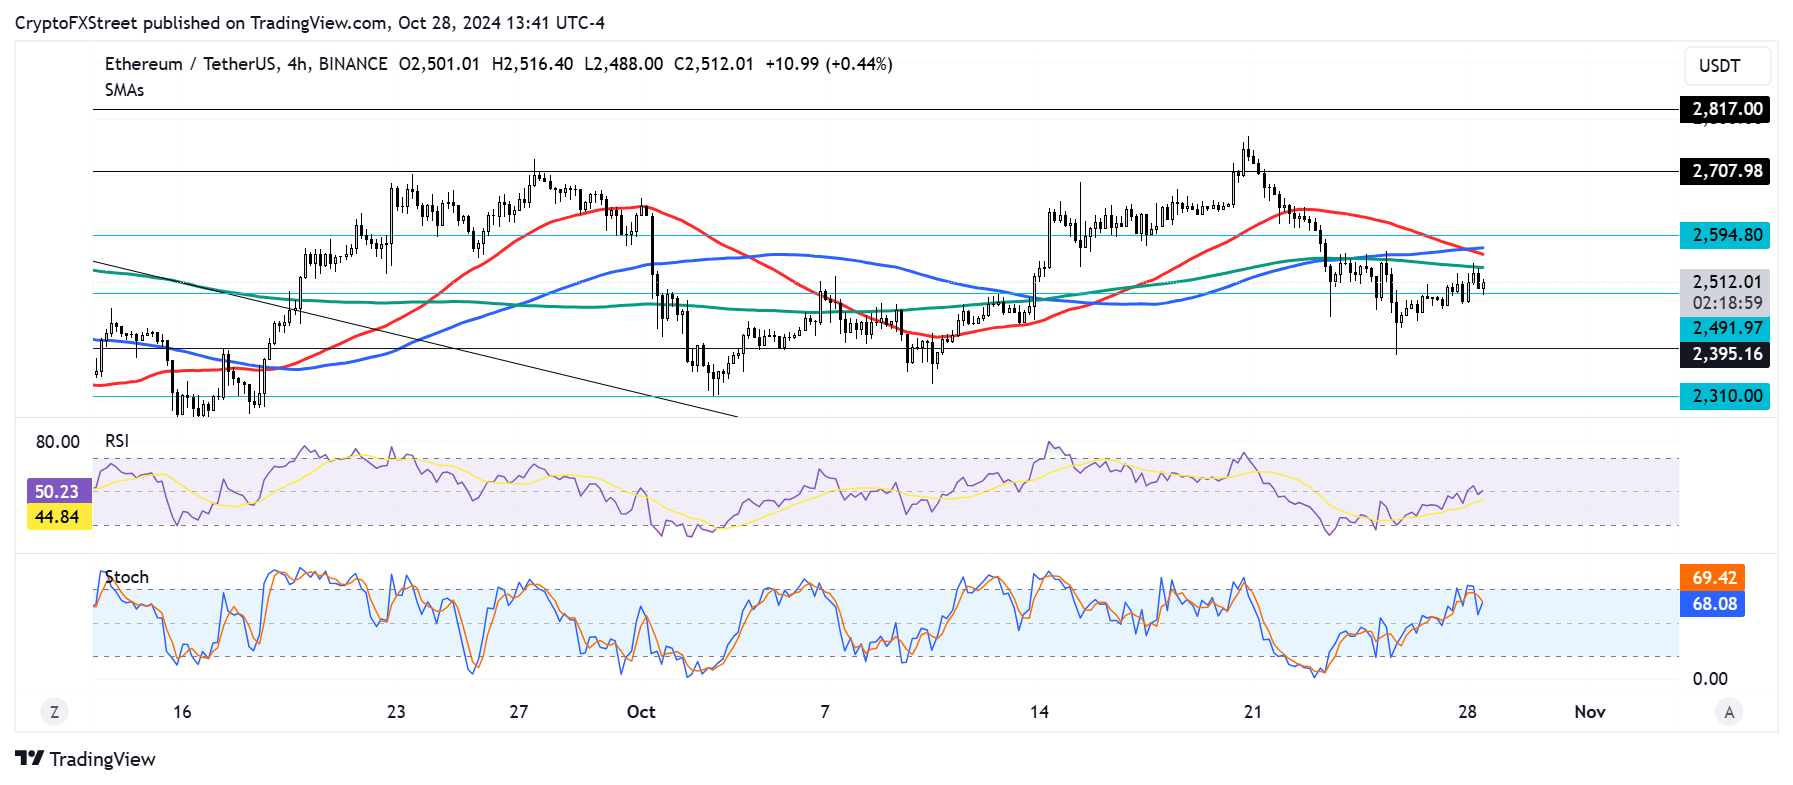
ETH/USDT 4-hour chart
A successful move above these SMAs could see ETH flip the $2,594 resistance into a support level and tackle the $2,707 key level.
The Relative Strength Index (RSI) momentum indicator is at its midpoint, indicating neutral investor sentiment.
A daily candlestick close below $2,395 will invalidate the thesis.
Ethereum FAQs
Ethereum is a decentralized open-source blockchain with smart contracts functionality. Its native currency Ether (ETH), is the second-largest cryptocurrency and number one altcoin by market capitalization. The Ethereum network is tailored for building crypto solutions like decentralized finance (DeFi), GameFi, non-fungible tokens (NFTs), decentralized autonomous organizations (DAOs), etc.
Ethereum is a public decentralized blockchain technology, where developers can build and deploy applications that function without the need for a central authority. To make this easier, the network leverages the Solidity programming language and Ethereum virtual machine which helps developers create and launch applications with smart contract functionality.
Smart contracts are publicly verifiable codes that automates agreements between two or more parties. Basically, these codes self-execute encoded actions when predetermined conditions are met.
Staking is a process of earning yield on your idle crypto assets by locking them in a crypto protocol for a specified duration as a means of contributing to its security. Ethereum transitioned from a Proof-of-Work (PoW) to a Proof-of-Stake (PoS) consensus mechanism on September 15, 2022, in an event christened “The Merge.” The Merge was a key part of Ethereum's roadmap to achieve high-level scalability, decentralization and security while remaining sustainable. Unlike PoW, which requires the use of expensive hardware, PoS reduces the barrier of entry for validators by leveraging the use of crypto tokens as the core foundation of its consensus process.
Gas is the unit for measuring transaction fees that users pay for conducting transactions on Ethereum. During periods of network congestion, gas can be extremely high, causing validators to prioritize transactions based on their fees.
Recommended Articles


