

Bitcoin Drops 2%, Threatening $70,000 Mark After US October CPI Tops Estimates

Source Tradingkey

TradingKey - Higher-than-expected US October CPI sparks rate hike concerns; BTC slumps 2%, kicking off the battle to defend $70,000.

On November 11, Bitcoin (BTC) plunged following the release of CPI data, tumbling 2% in short order to break below $73,000 and dropping as low as around $72,787 to hit its August 21 low, putting the previously defended core $70,000 threshold in severe jeopardy.

Data released yesterday by the U.S. Bureau of Labor Statistics (BLS) showed that the October CPI rose 0.4% month-over-month, higher than the market expectation of 0.3%; core CPI, excluding food and energy, rose 0.3% month-over-month, also exceeding the market expectation of 0.2%.

Following the data release, market expectations regarding the Federal Reserve's policy stance for the December 9 FOMC meeting turned sharply hawkish, with futures-implied probabilities of rate hikes and expectations for the duration of elevated interest rates surging significantly. In addition, the 2-year U.S. Treasury yield surged 14 basis points to around 4.69%. The anticipation of tighter liquidity dealt a direct blow to non-yielding and highly leveraged assets, triggering broad-based losses across cryptocurrencies.

In addition, Federal Reserve officials voiced hawkish stances regarding interest rate hikes. Among them, Fed Governor Christopher Waller stated that inflation remains too high and shows signs of spreading. He explicitly noted that if core inflation fails to cool, the Fed should consider raising interest rates by 50 basis points at its December policy meeting. Meanwhile, Fed Vice Chair Bowman warned that inflationary pressures stemming from energy prices, tariffs, and large-scale AI-related investments could significantly delay the timeline for inflation to return to the 2% target.

The dashed hopes of Fed rate-cut dividends and liquidity tightening driven by hotter-than-expected inflation shattered market illusions of monetary easing, sending the US Dollar Index and Treasury yields surging in tandem and sharply tightening Bitcoin's liquidity. In the few hours around the CPI release, crypto market liquidations across the network once again exceeded $630 million, with long positions accounting for over 80%. These liquidations triggered mandatory market orders, amplifying the downward move.

Bitcoin is currently testing its long-term bull-bear dividing line (the 200-day MA), corresponding to a price range of $71,500–$72,500. If bulls can establish a solid base above this line, hopes for a swing recovery remain alive.
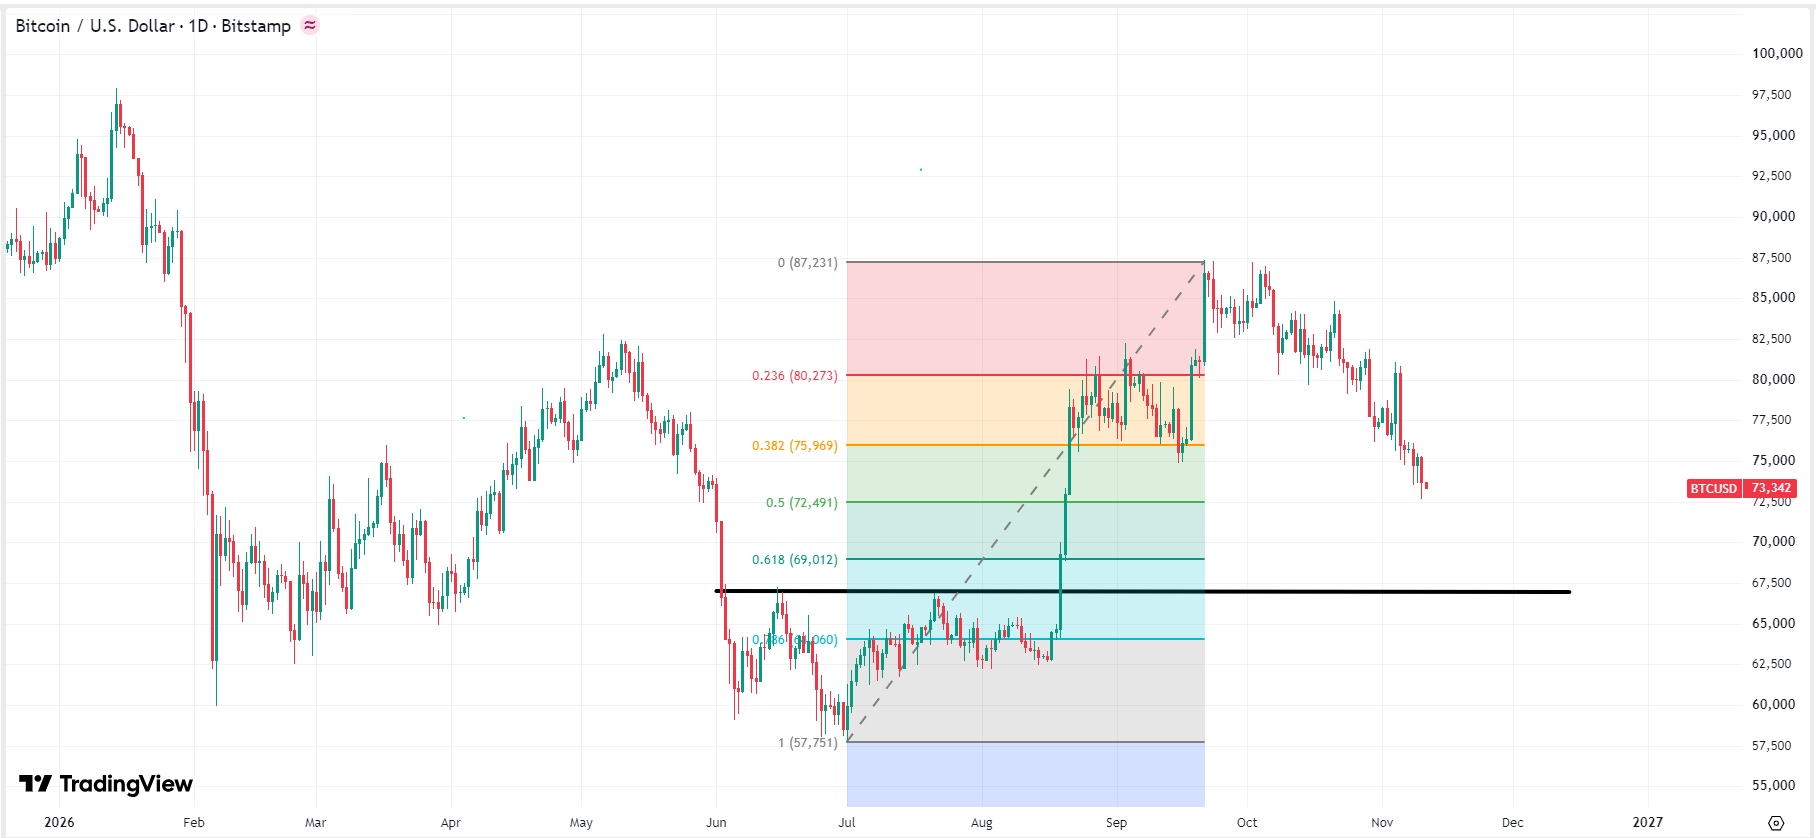
bitcoin-btc-price-57cbce3e13604fc6b1192e3f3dbf9780Bitcoin price chart, Source: TradingView

However, if the U.S. Producer Price Index (PPI) to be released on November 13 and the Fed minutes to be released on November 18 continue to deliver hawkish signals, Bitcoin's daily candle body will very likely break below the key $70,000 mark. Technically, this would trigger secondary stop-loss selling, creating a strong likelihood of a direct drop to test the long-term support zone at $68,000.

Disclaimer: For information purposes only. Past performance is not indicative of future results.
placeholder
China's factories are pricing in 5.7%. Its shoppers are pricing in 0.7%.China's October PPI rose 5.7% year on year, the fastest since June 2022, while CPI slowed to 0.7% and core CPI to 0.8%. Input prices rose faster than factory-gate prices, squeezing mid-stream margins by roughly five percentage points. The Hang Seng fell 0.13% on a day the S&P 500 rose 2.35%, the only major market to sit out the risk-on session.
Author  Irene Q.
Nov 10, Tue
China's October PPI rose 5.7% year on year, the fastest since June 2022, while CPI slowed to 0.7% and core CPI to 0.8%. Input prices rose faster than factory-gate prices, squeezing mid-stream margins by roughly five percentage points. The Hang Seng fell 0.13% on a day the S&P 500 rose 2.35%, the only major market to sit out the risk-on session.
placeholder
Gold Price Analysis Today | Forex Gold Analysis | XAU/USD Analysis - November 11, 2026Get the latest gold price analysis, forex gold insights, and XAU/USD analysis for November 11, 2026. Read on for the details.
Author  Mitrade
Yesterday 02: 42
Get the latest gold price analysis, forex gold insights, and XAU/USD analysis for November 11, 2026. Read on for the details.
placeholder
Gold Tumbles Toward $4,000 as Hotter-Than-Expected CPI Boosts Fed Rate-Hike Bets, Bulls Eye $3,975 SupportAs of the Asian session on Wednesday (November 11), gold prices (XAUUSD) rebounded slightly after a sharp decline in the previous session, last trading near $4,040, up about 0.3% on the d
Author  TradingKey
Yesterday 02: 51
As of the Asian session on Wednesday (November 11), gold prices (XAUUSD) rebounded slightly after a sharp decline in the previous session, last trading near $4,040, up about 0.3% on the d
placeholder
Core CPI stuck at 0.3% for a third straight month — and BLS couldn't publish the number that would explain itOctober headline CPI rose 0.4% m/m against a 0.3% consensus, and core rose 0.3% for a third consecutive month against 0.2% expected. BLS published no year-on-year figures because October 2025 collection was lost to the government shutdown. Energy cooled to 0.7% from 5.2% — shelter, food and transport services did the rest. The 2-year yield jumped 18 to 21 basis points, the 10-year added 12, and the dollar closed at 102.25.
Author  Irene Q.
Yesterday 03: 09
October headline CPI rose 0.4% m/m against a 0.3% consensus, and core rose 0.3% for a third consecutive month against 0.2% expected. BLS published no year-on-year figures because October 2025 collection was lost to the government shutdown. Energy cooled to 0.7% from 5.2% — shelter, food and transport services did the rest. The 2-year yield jumped 18 to 21 basis points, the 10-year added 12, and the dollar closed at 102.25.
placeholder
Bitcoin lost its 200-day average — but the exit started three sessions before the CPIBitcoin fell 2.5% to about $73,400 on 11 November, an 11-week low, breaking its 200-day moving average near $73,100. The 24-hour liquidation tally reached $632 to $705 million, roughly 82% of it longs. But spot ETF outflows began three sessions earlier and USDT's market cap has shrunk $6.6 billion in 60 days — the leveraged length left before the inflation print did. A double top at 81,890 and 81,080 leaves a measured target of 69,366.
Author  Suzie
Yesterday 03: 22
Bitcoin fell 2.5% to about $73,400 on 11 November, an 11-week low, breaking its 200-day moving average near $73,100. The 24-hour liquidation tally reached $632 to $705 million, roughly 82% of it longs. But spot ETF outflows began three sessions earlier and USDT's market cap has shrunk $6.6 billion in 60 days — the leveraged length left before the inflation print did. A double top at 81,890 and 81,080 leaves a measured target of 69,366.
goTop
quote