


Pi Network Price Forecast: PI defends key support as crypto sentiment sinks
- Pi Network hovers around $0.0750 on Tuesday after three consecutive days of losses, with a resistance trendline capping the rebound attempt.
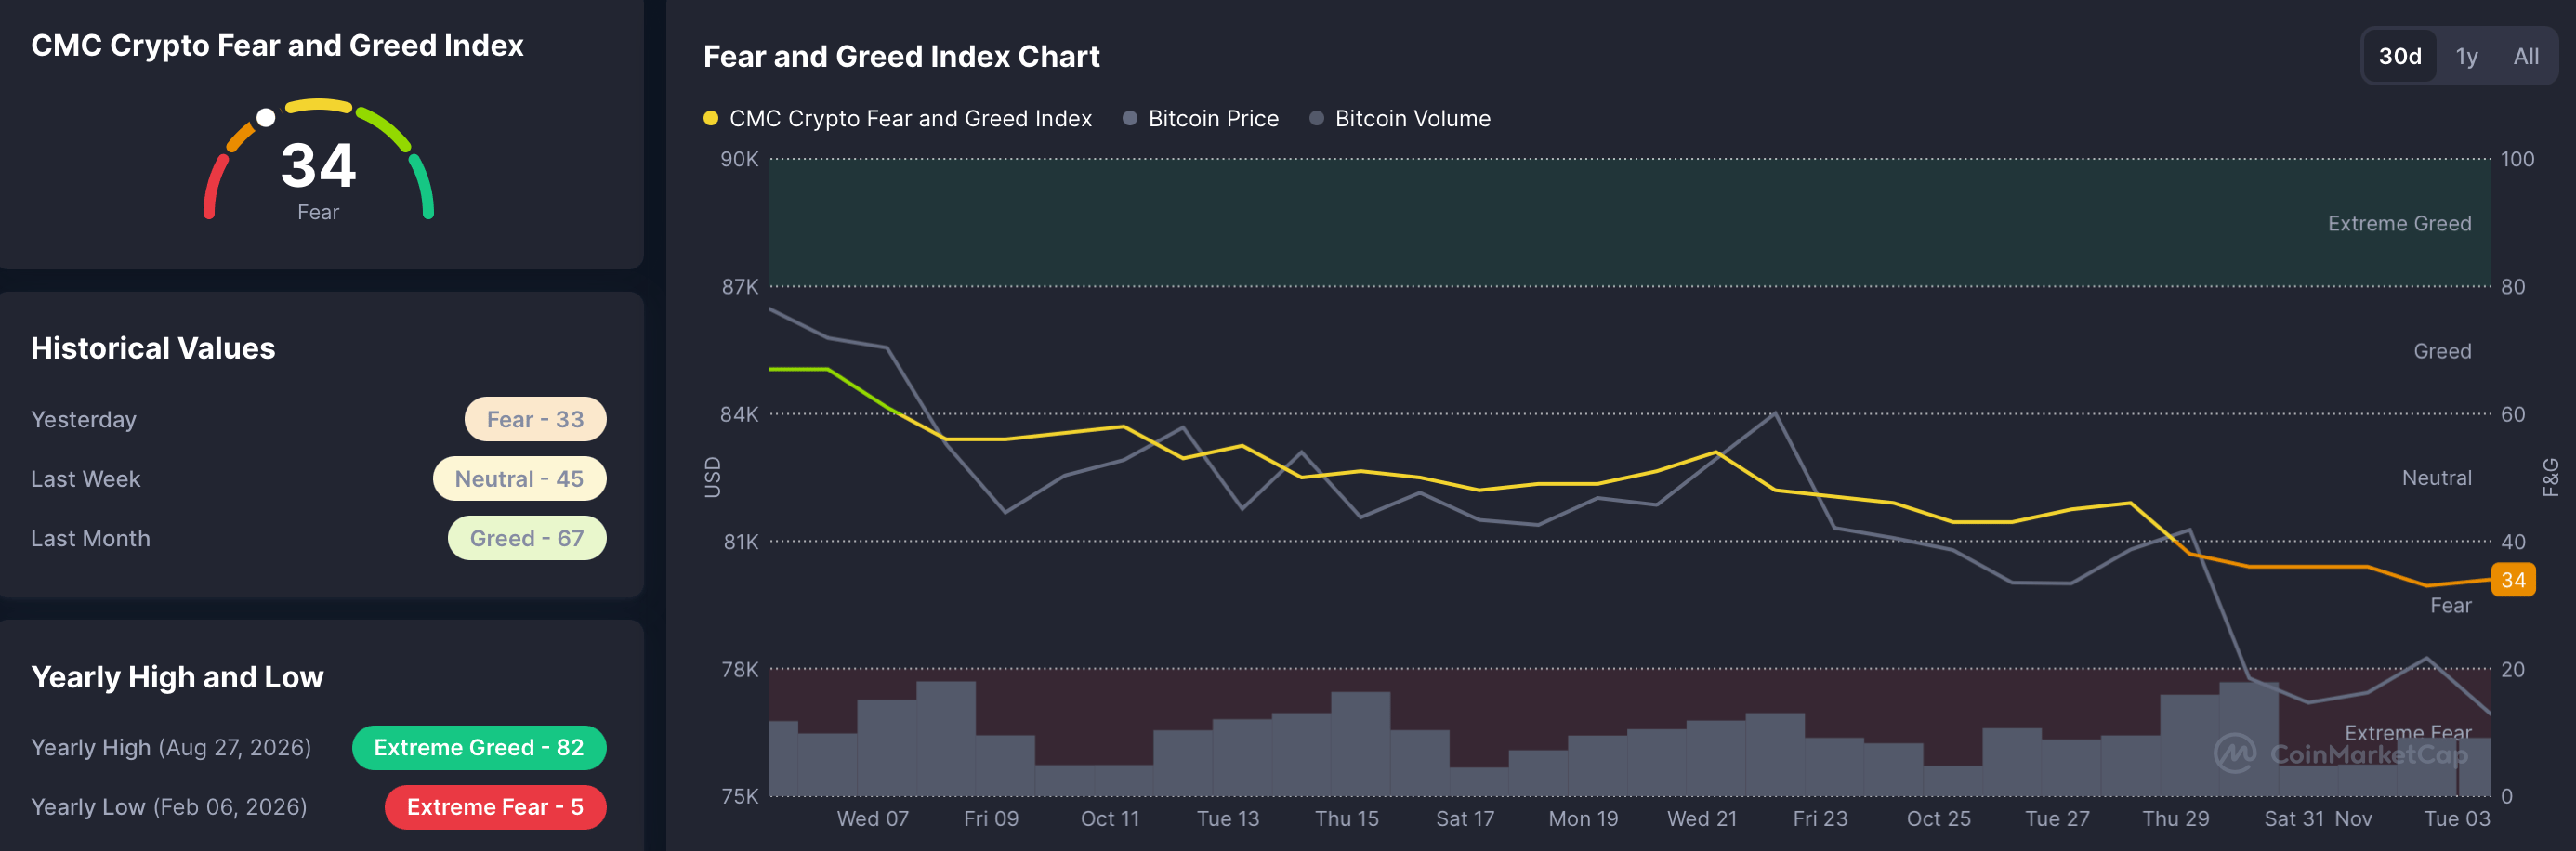
- Crypto market sentiment is weak following the $6.3 billion Binance hack, with the Fear and Greed Index down to 34.
- The technical outlook for the PI token is mixed, as the price remains capped while momentum recovers to neutral levels.
Pi Network (PI) trades around $0.0750 at press time on Tuesday, after three straight bearish daily closes amid intense headwinds. The broader cryptocurrency market is seeing weakening social sentiment following the $6.3 billion Binance hack, weighing on speculative tokens. The technical outlook for Pi Network is mixed, as the price defends a near-term support but remains capped below a long-term overhead resistance trendline.
Broader market fear weighs on PI
The $6.3 billion Binance hack accelerated the decline in social sentiment in the broader crypto market. CoinMarketCap’s Fear and Greed Index is down to 34 on Tuesday from 45 last week, suggesting that fear is sinking into investors’ sentiment.
Santiment data shows that bullish comments for Bitcoin, Ethereum (ETH), and Ripple (XRP) are collapsing relative to bearish ones. The bullish-to-bearish comment ratios for BTC and XRP are 0.69 and 0.61, respectively, while ETH stands at 1.14.
If the Fear and Greed Index slips below 20 or the ratios remain below 1, it could indicate “Extreme Fear” in the market. However, such extreme Fear, Uncertainty, and Doubt (FUD) phases often create a strong rebound opportunity once the panic has had time to settle.

Technical outlook: Will Pi Network rebound to ignite a breakout rally?
Pi Network trades at $0.0766 at press time on Tuesday, keeping a bearish near-term tone. The price holds beneath both the downward resistance trendline at $0.0784, which has remained intact since July 20.
The 50-day Exponential Moving Average (EMA) at $0.0825 reinforces the resistance trendline, suggesting rallies are likely to be capped by overhead supply. A confirmed breakout above this zone could extend the rally toward the 50% retracement level of the downswing from $0.1394 to $0.0704 at $0.1049.
The Moving Average Convergence Divergence (MACD) hovers above the signal line in negative territory on the daily chart, while the Relative Strength Index (RSI) near 39 suggests only modest downside pressure.
On the downside, short-term demand is at the October 15 low of $0.0740, while the main structural floor sits at the Fibonacci cycle low near $0.0704, where a deeper slide would likely meet more meaningful buying interest.
(The technical analysis of this story was written with the help of an AI tool. Know more.)
Recommended Articles


