


Bitcoin braces for US midterm elections as historical sell-offs revive downside concerns
- Bitcoin hovers below $78,000 on Monday, holding above its 200-day EMA at $76,459 ahead of the US midterm elections due on Tuesday.
- Bitcoin fell 16% and 37% during the November 2022 and 2018 US midterm elections, respectively.
- BTC spot ETFs could emerge as dark horses, with sustained inflows potentially offsetting the historical pattern of losses around midterms.
Bitcoin (BTC) braces for the impact of the US midterm elections, just a week after the $6 billion hack from Binance. Historically, congressional elections have negatively affected not just the president’s party but also Bitcoin. In the last 22 midterms, the ruling party has gained House seats only twice, while the three most recent elections coincided with Bitcoin’s bear market bottoms.
Considering the next midterms on Tuesday, November 3, in focus, the broader crypto market ponders: “Will Bitcoin extend its losses after the elections?”
The curse of the US electoral cycle
The US midterm elections have historically coincided with a correction in Bitcoin's price. The 2022 November elections dropped BTC prices to the 2022 bear market bottom of $15,476 in just 13 days, whereas the 2018 and 2014 elections coincided with the $3,156 and $171 bottoms in 39 days and 71 days, respectively.
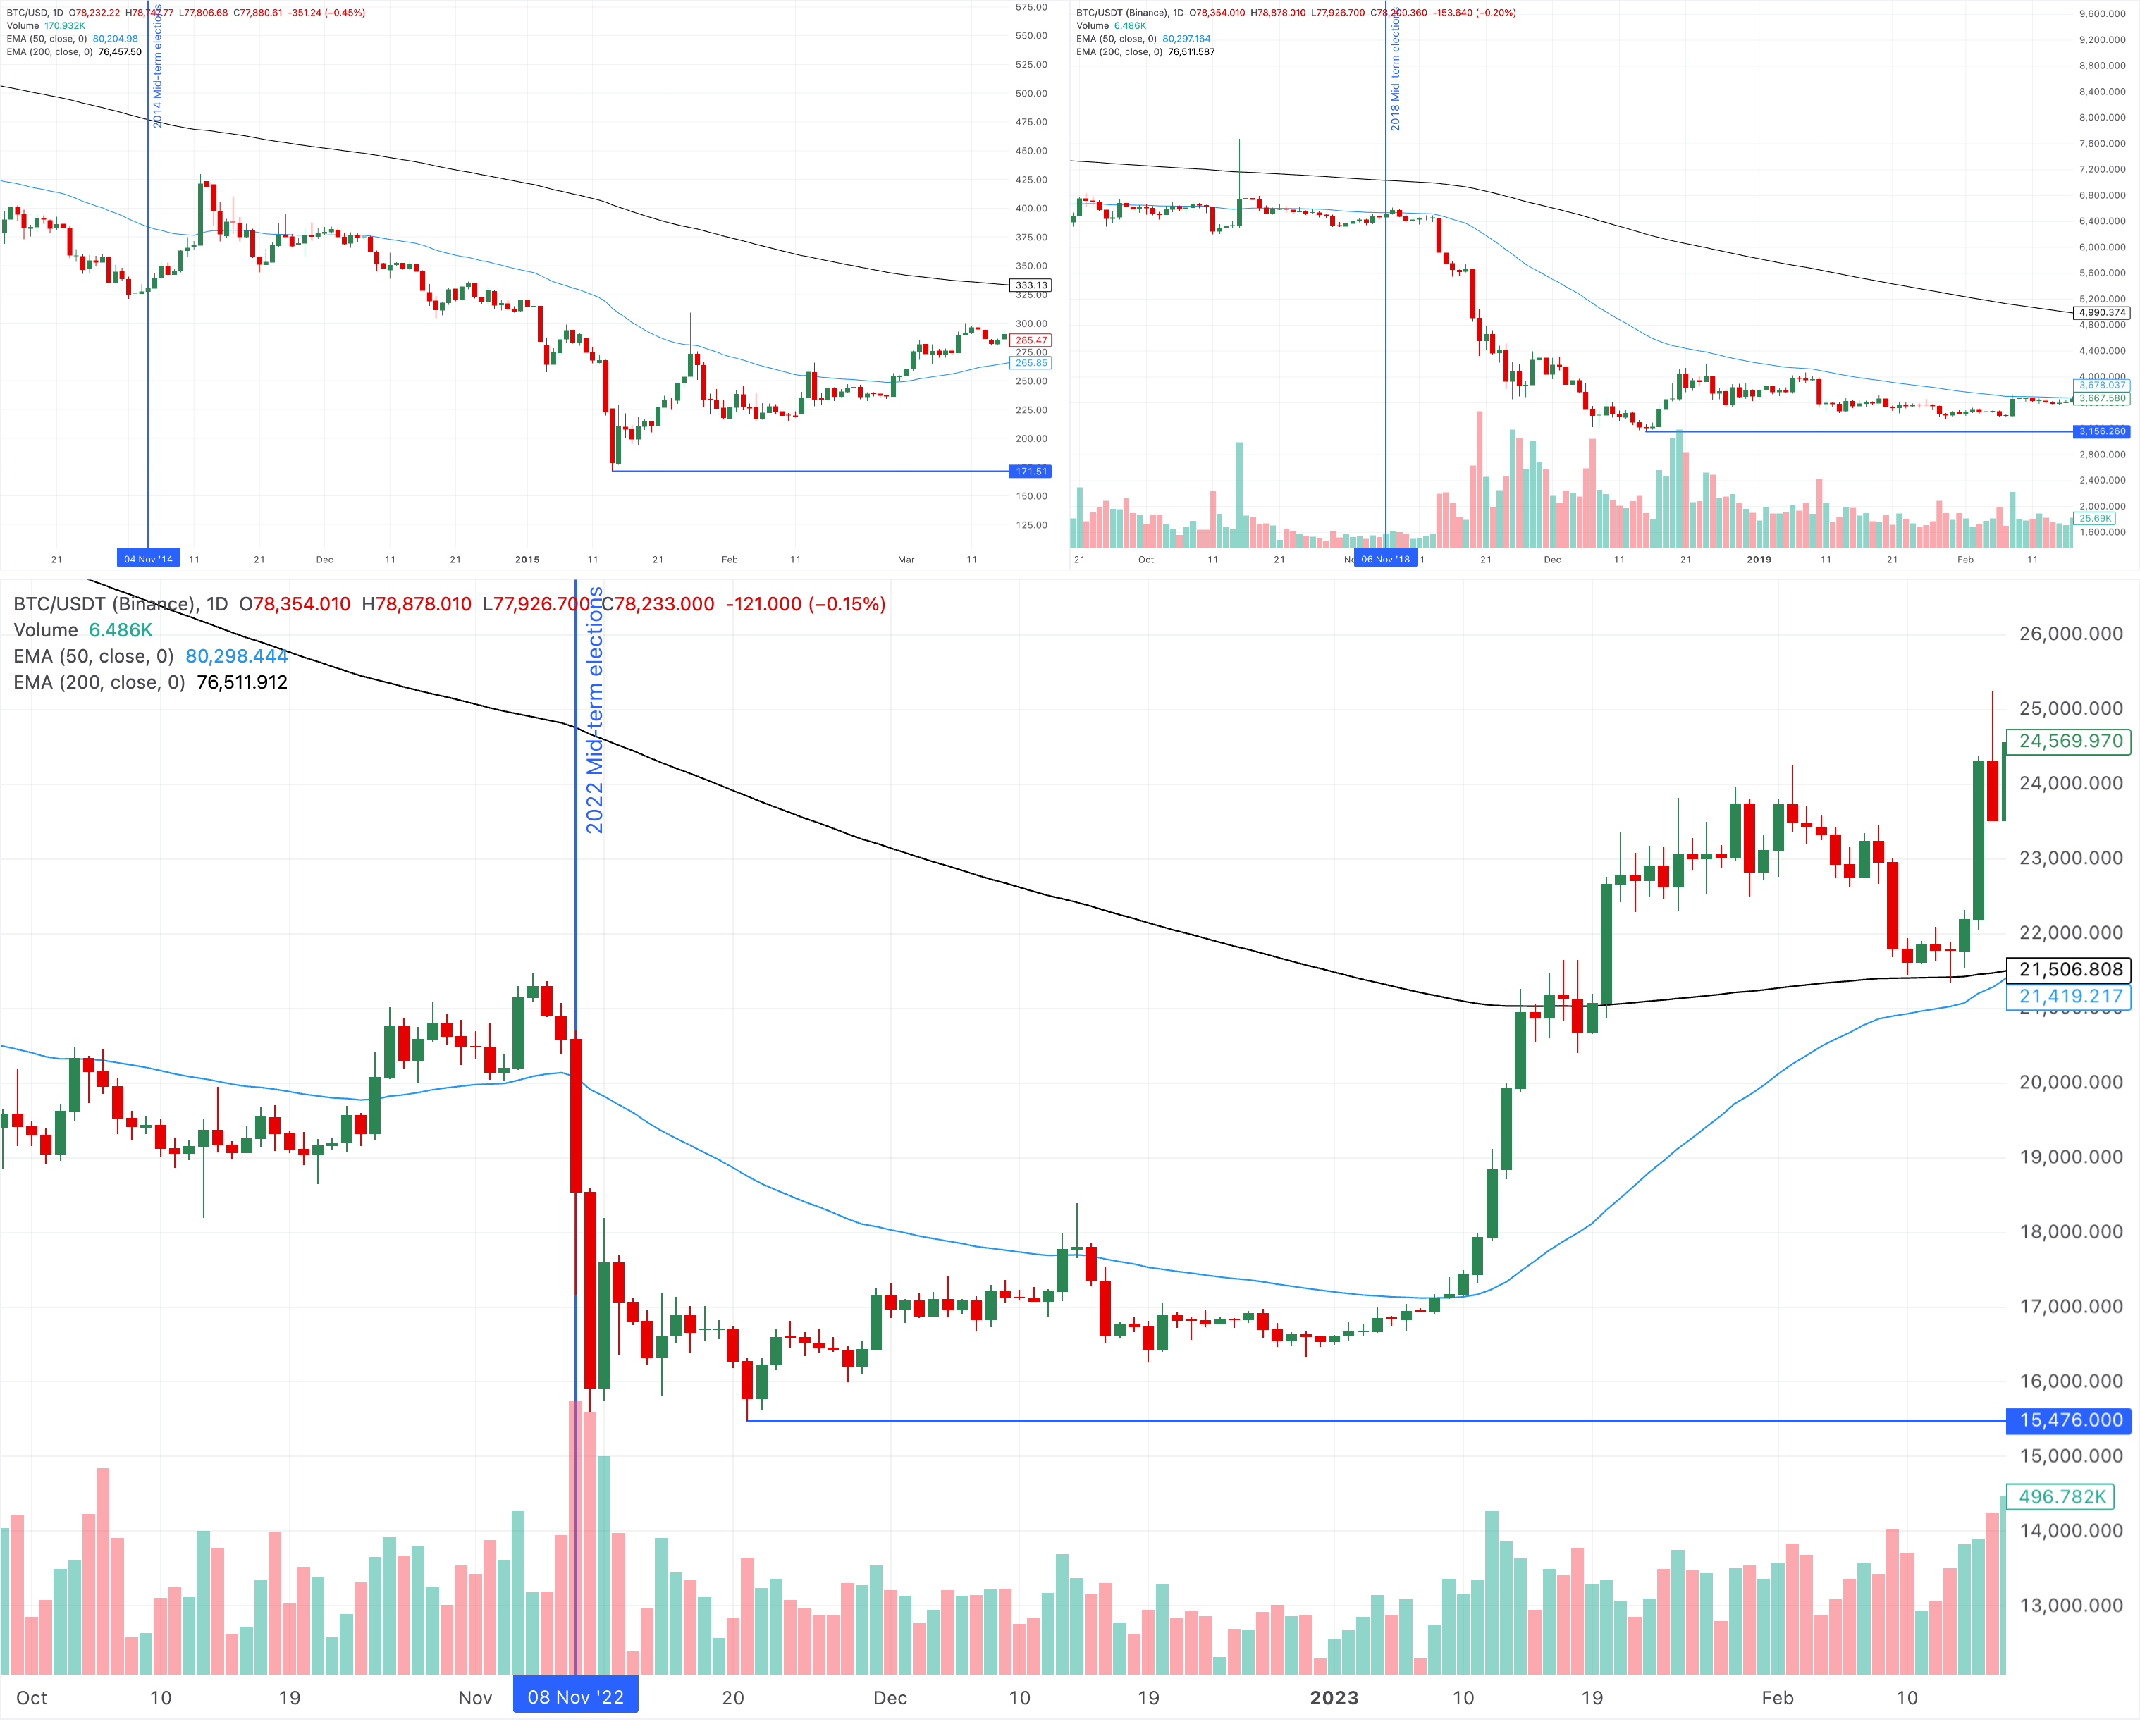
The correction at the end of midterm years aligns with Bitcoin's four-year cycle, explained earlier by FXStreet. US presidential elections coincide with Bitcoin halvings, which place the November elections at the center of the BTC four-year cycle, when the market has historically been approaching or experiencing a cyclical bear-market bottom.
In addition, the US midterm elections have resulted in a punishing Q4 for Bitcoin. CoinGlass data shows that Bitcoin has performed relatively well in November, averaging 34% gains, but the 2022 and 2018 midterm elections led to 16% and 36% declines, respectively, followed by 3% and 6% losses in December, totaling 14% and 43% losses in the last quarter.
Meanwhile, the 2014 midterm elections saw an 11% rise in November, followed by a 15% decline in December, for a net 17% loss over the last three months.
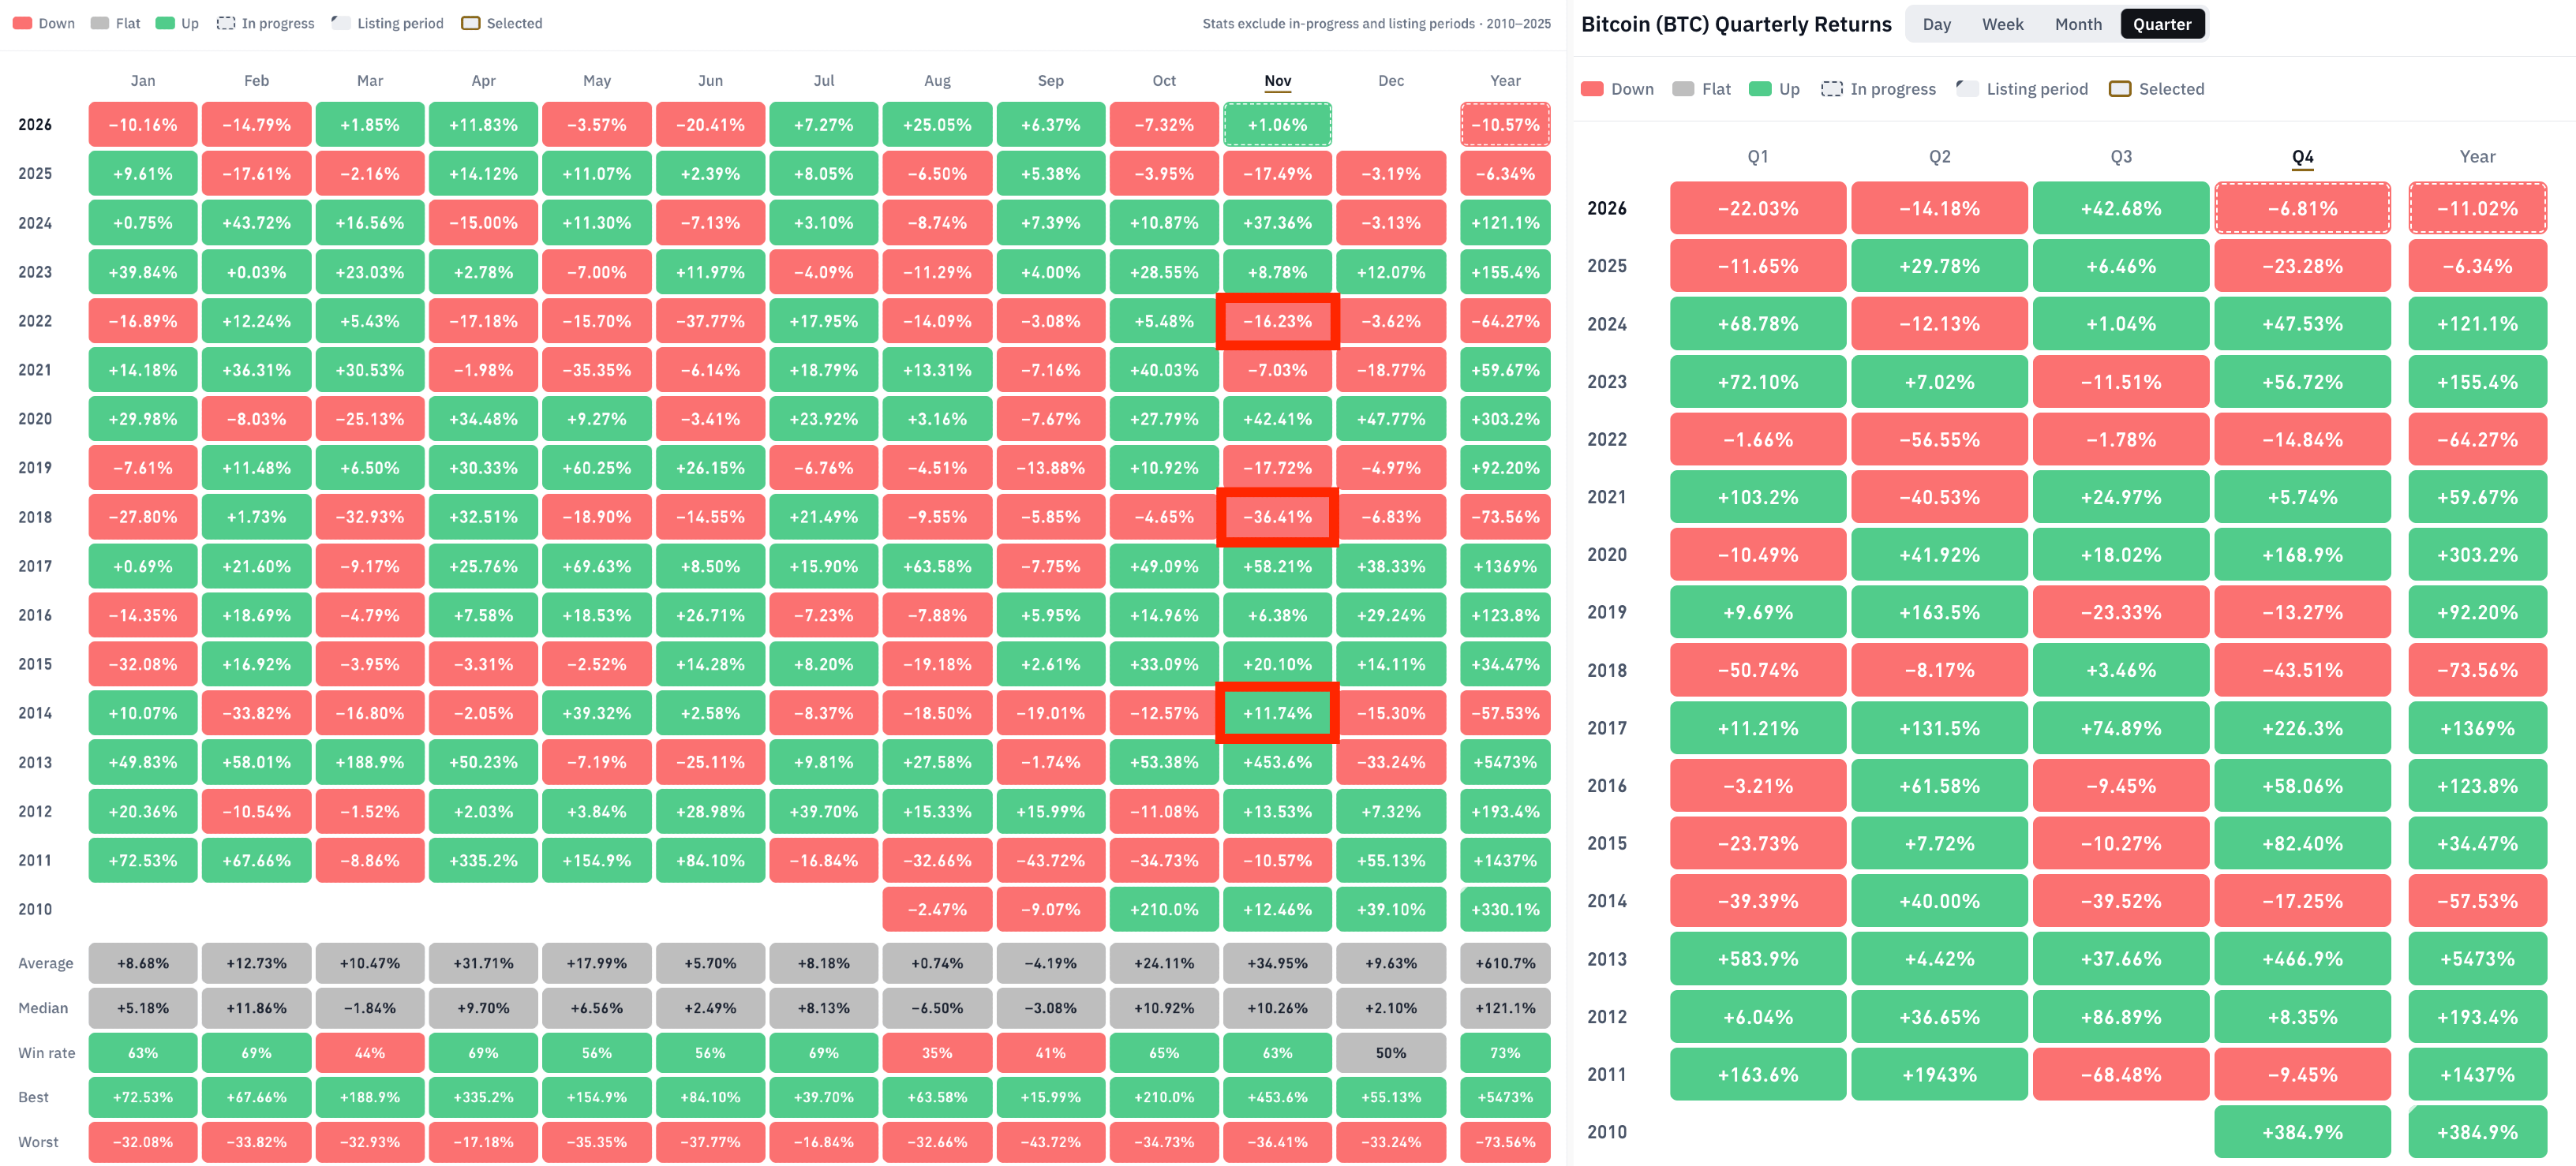
If the historical cycle repeats, Bitcoin could see a sharp correction by the end of 2026, risking a return to the annual low of $57,800. However, the narrowing gap between the voting and bear-market bottoms also suggests a quick rebound could be seen, limiting downside risk.
Bitcoin spot ETFs challenge the bearish path forward
Bitcoin’s dynamics around the November elections have been mostly bearish, with no institutional inflows. However, this year, the dynamics could change with Bitcoin spot Exchange-Traded Funds (ETFs) in play.
Bitcoin ETFs hold total net assets of $98 billion as of October 30, down from a peak of $152 billion in July 2025. Since their inception in January 2024, ETF inflows have heavily influenced Bitcoin’s spot price.
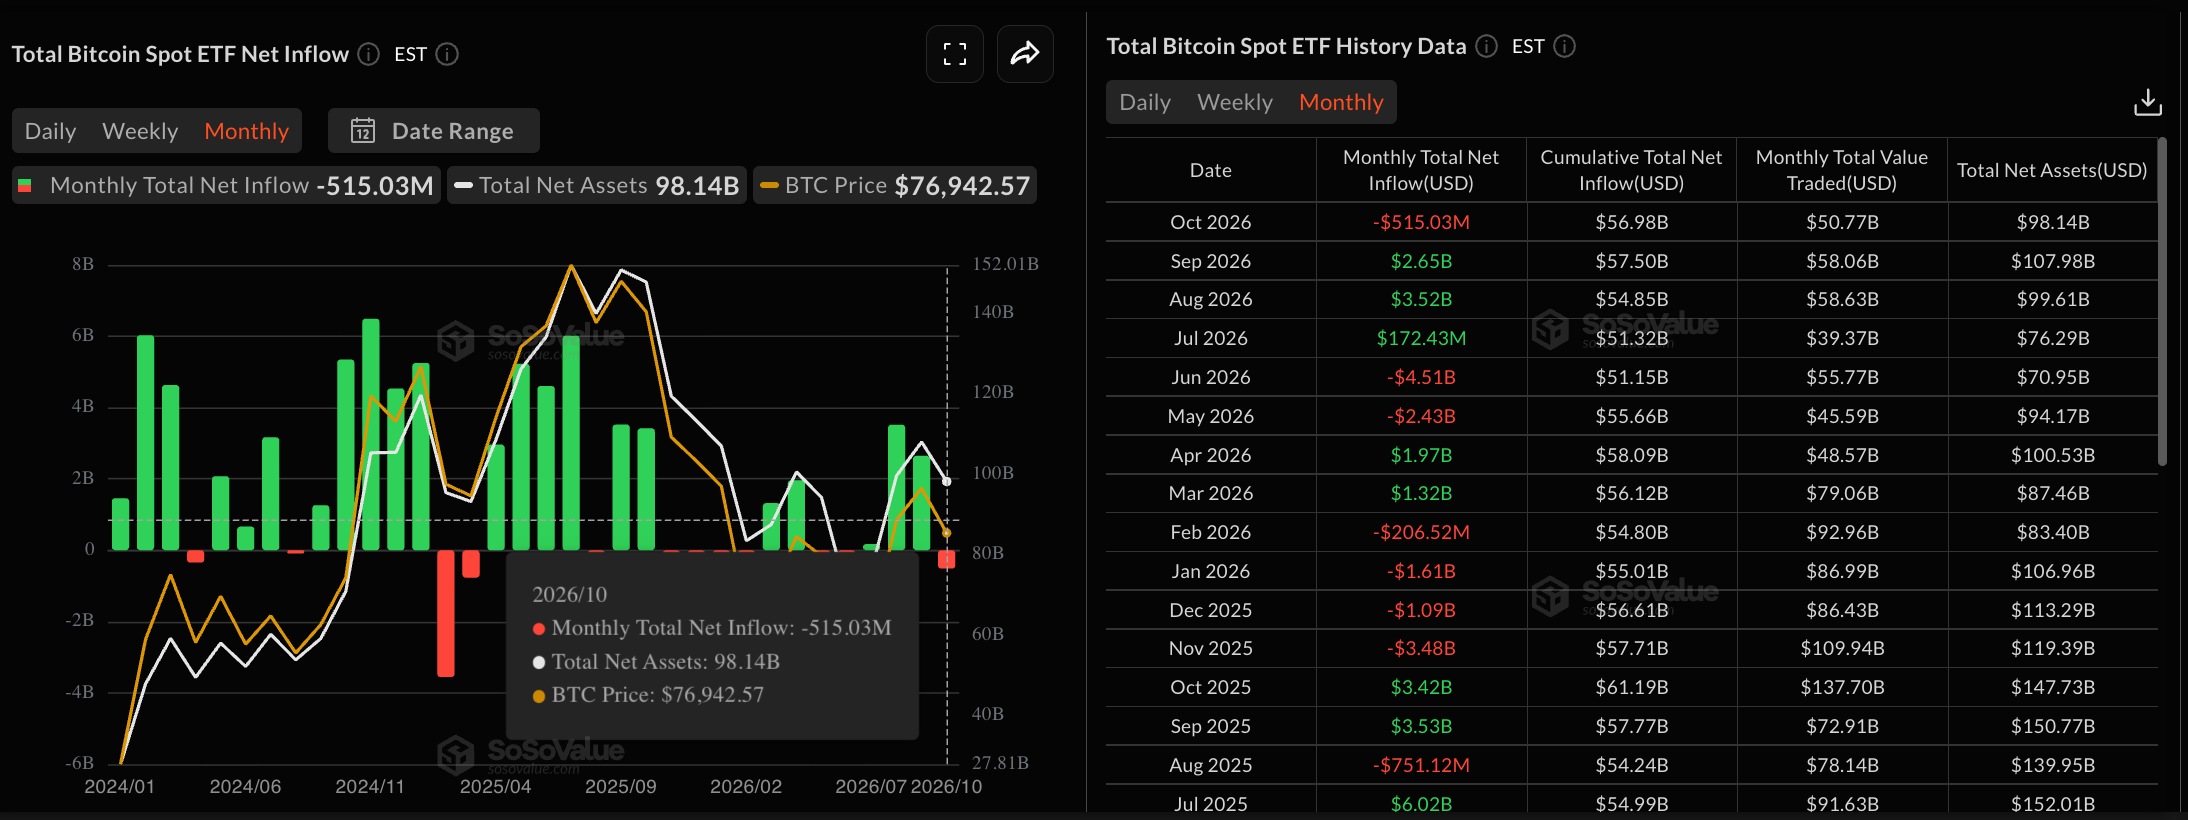
Potential inflows in Bitcoin spot ETFs in November and December could soften the impact of a shift in the US Senate and the House of Representatives.
Conclusion
The curse of midterms is likely to persist in US politics. According to Kalshi's midterm forecast data, the Democratic Party is heavily favored to take control of both chambers of Congress. Forecasts indicate a 94% probability of a Democratic majority in the House and a 74% probability in the Senate.

However, the bearish effect on Bitcoin will depend on institutional inflows. The premier digital asset’s ability to hold the critical 200-day Exponential Moving Average (EMA) baseline at $76,459 will serve as the ultimate indicator that BTC has finally broken its mid-term curse. If this support breaks, Bitcoin could revisit the annual low of $57,800 or fall below it.
Recommended Articles


