


Top 3 Price Predictions: Bitcoin, Ethereum, Ripple – BTC, ETH and XRP recover as Big Tech earnings take center stage
- Bitcoin climbs above $80,900 on Wednesday, extending its recovery, as investors assess upcoming Big Tech earnings.
- Ethereum consolidates between its 100-day and 200-day EMAs, awaiting the next directional move.
- XRP extends recovery after finding support around the $1.300 mark earlier this week.
Bitcoin (BTC), Ethereum (ETH) and Ripple (XRP) extend their recovery on Wednesday as investors turn their attention to major technology companies' earnings reports. Microsoft and Alphabet are due to report their Q3 earnings on Wednesday, followed by Amazon on Thursday. Results that justify continued heavy investment in Artificial Intelligence (AI) could ease concerns over hyperscaler valuations, while disappointing figures could extend the ongoing AI-driven market sell-off.
BTC climbs above $80,900, while ETH consolidates between key moving averages. Meanwhile, XRP extends its recovery after finding support near $1.300 earlier this week.
Bitcoin heads toward the $81,000 mark
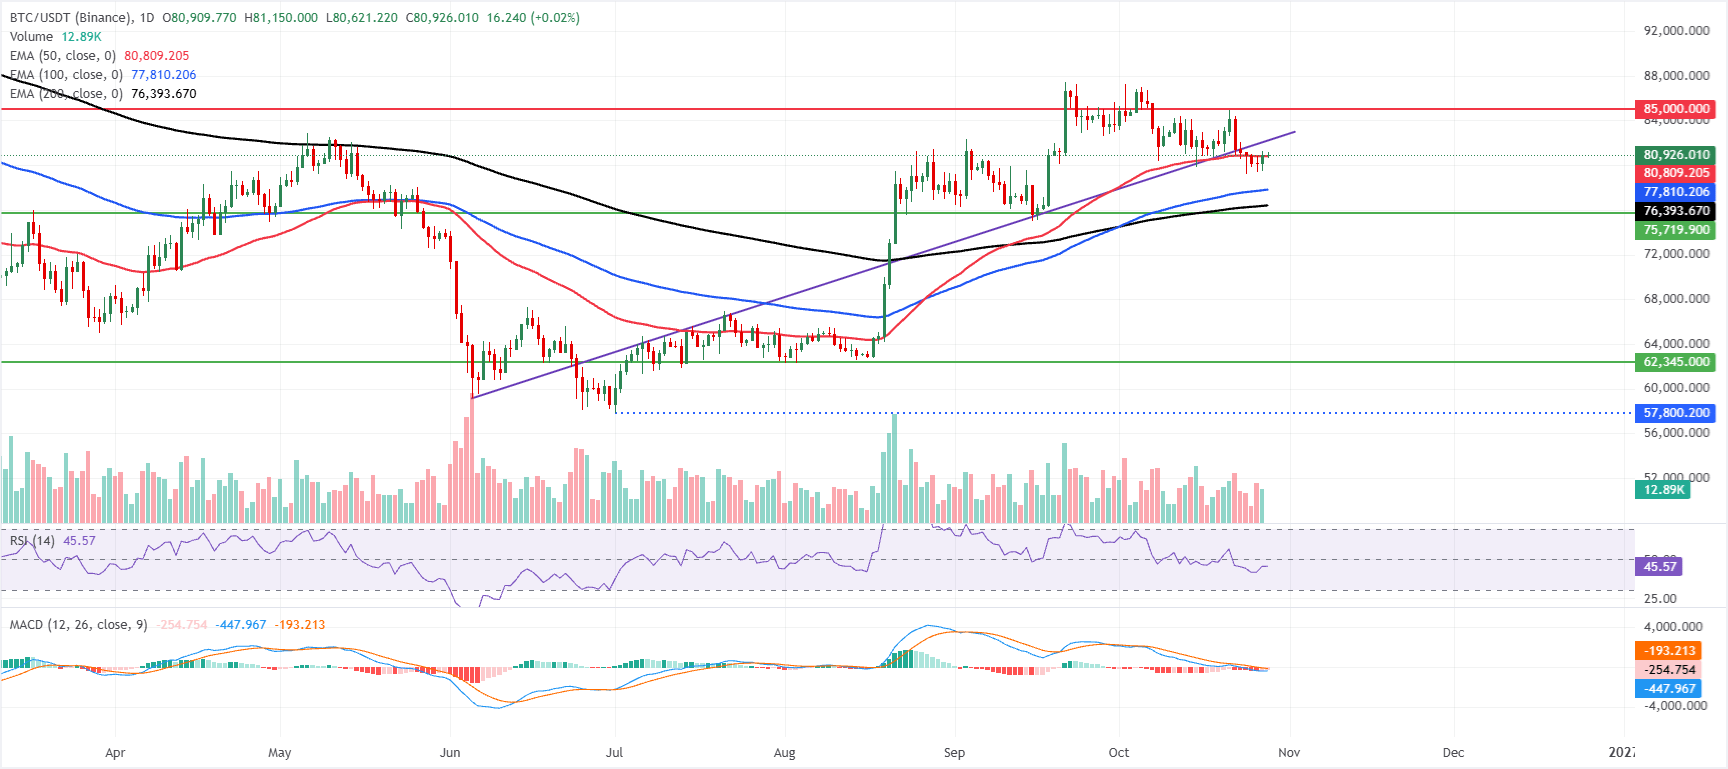
Bitcoin price trades at $80,926 on Wednesday, maintaining a constructive bias as it stays above the 50-day, 100-day and 200-day Exponential Moving Averages (EMAs), with the nearest dynamic support at the 50-day EMA around $80,810.
The cluster of EMAs below price suggests the broader uptrend remains intact, though the Relative Strength Index (RSI) near 46 and the negative Moving Average Convergence Divergence (MACD) reading hint that bullish momentum is losing steam and rallies could face increasing headwinds.
On the topside, immediate resistance aligns with the horizontal barrier at $85,000, where a daily close higher would reopen room for a stronger advance.
On the downside, initial support is seen at the 50-day EMA near $80,810, followed by the 100-day EMA around $77,810 and then the 200-day EMA near $76,394, with a break below this EMA stack likely signaling a deeper corrective phase.
Ethereum consolidates between key EMAs
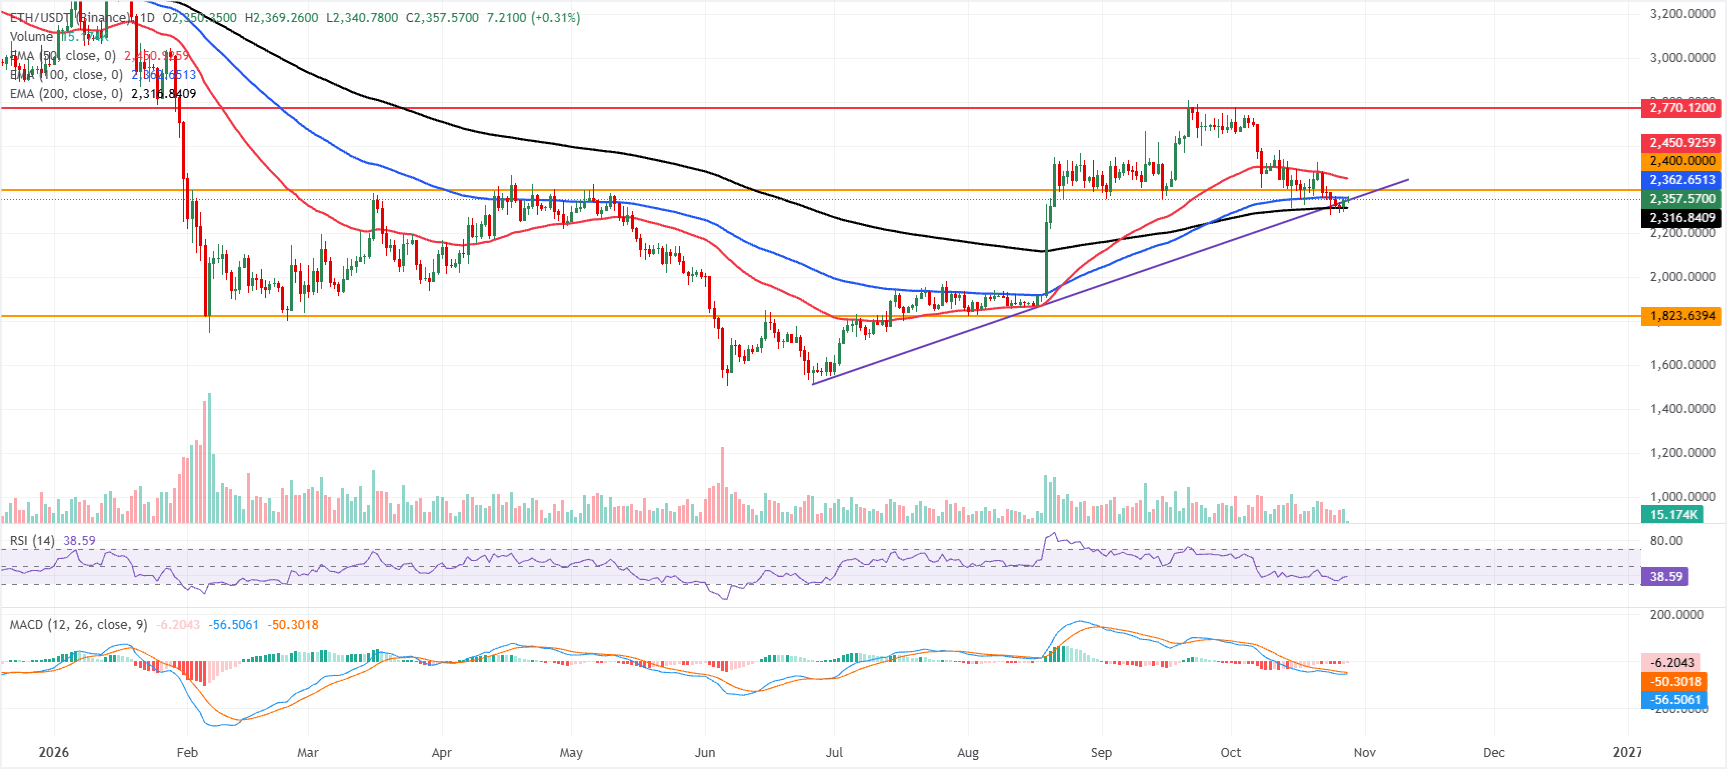
Ethereum price trades at $2,357 on Wednesday, hovering between its major EMAs and leaving the near-term tone neutral to mildly bearish. Price holds just above the 200-day EMA at $2,316 and the former rising trendline support-turned-pivot around $2,351. Still, it remains capped beneath the 100-day EMA at $2,362 and well below the 50-day EMA at $2,450, suggesting rallies will meet supply as prices approach these levels.
The RSI at 38 sits below the midline, hinting at subdued buying pressure. At the same time, the MACD stays in negative territory even as it edges higher, indicating that any recovery attempts are still unfolding within a corrective phase rather than a confirmed bullish reversal.
On the topside, immediate resistance is located at the 100-day EMA near $2,362, with a break exposing the psychological and structural barrier at $2,400; above that, the 50-day EMA at $2,450 and the more distant horizontal level at $2,770 form subsequent caps.
On the downside, first support appears at the trendline pivot around $2,351, followed by stronger demand at the 200-day EMA at $2,316; a daily close below that zone would open the way toward deeper horizontal support near $1,823, reinforcing the broader corrective bias.
XRP extends recovery
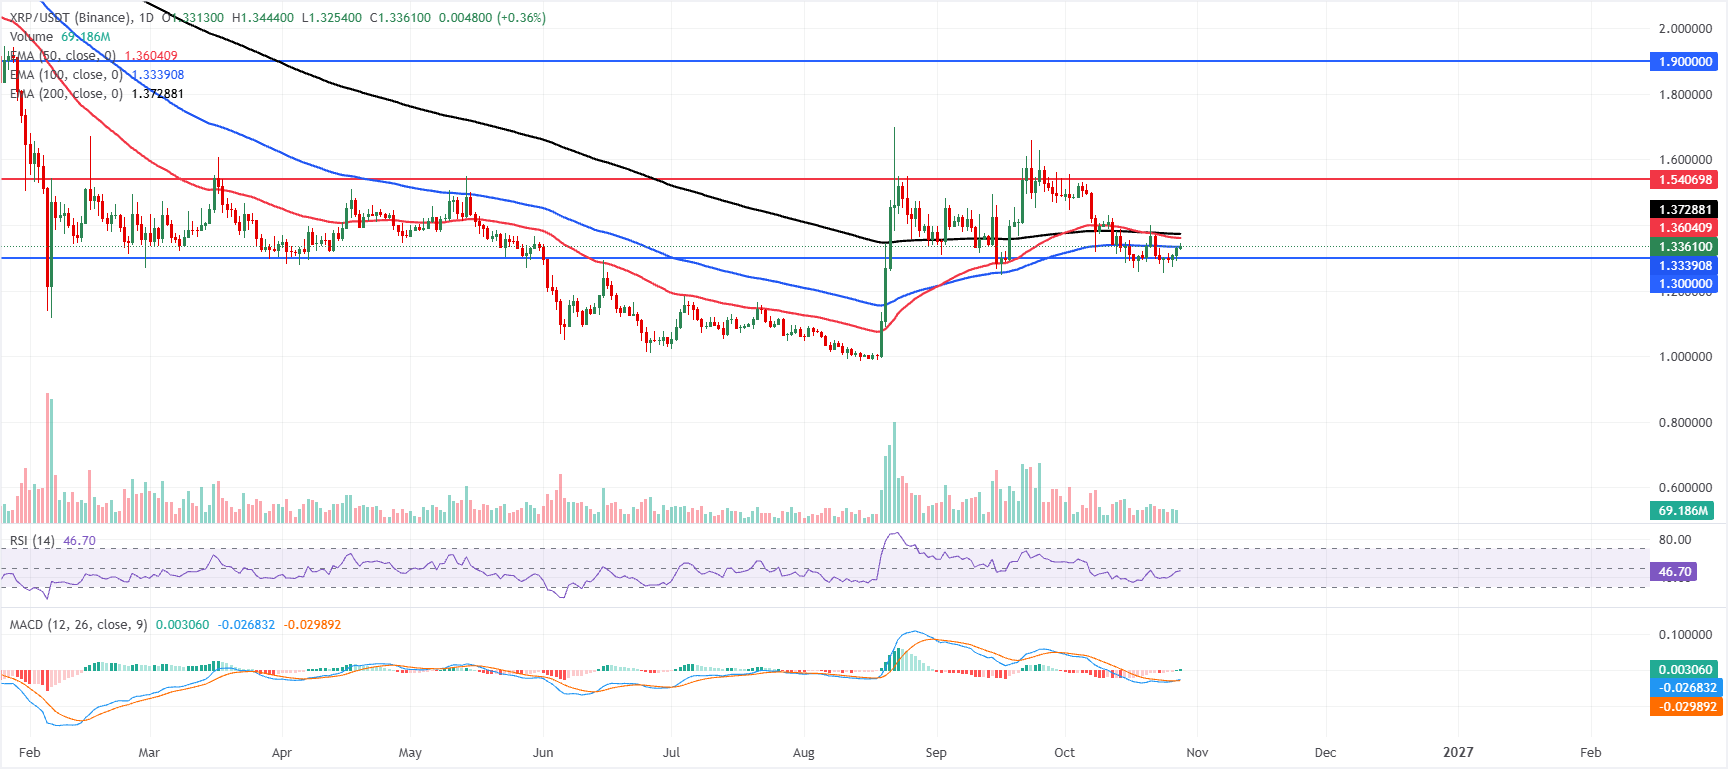
XRP trades at $1.336 on Wednesday, below the 50-day and 200-day EMAs at $1.360 and $1.372, keeping the near-term bias bearish despite the latest uptick. XRP holds marginally above the 100-day EMA at $1.333, offering initial trend support, while the RSI around 46 hints at subdued momentum. The MACD has turned slightly positive, suggesting that selling pressure is fading, yet price remains constrained by overhead EMAs.
On the topside, immediate resistance emerges at the 50-day EMA at $1.360, followed by the 200-day EMA at $1.372; a daily close above these clustered averages would be needed to open the way toward the higher horizontal barrier at $1.540 and then $1.900.
On the downside, initial support is seen at the 100-day EMA at $1.333, ahead of the horizontal floor at $1.300; a break below $1.300 would reinforce the bearish tone and expose deeper losses, while holding above this zone keeps scope for further consolidation beneath the EMA cluster.
(The technical analysis of this story was written with the help of an AI tool. Know more.)
Crypto ETF FAQs
An Exchange-Traded Fund (ETF) is an investment vehicle or an index that tracks the price of an underlying asset. ETFs can not only track a single asset, but a group of assets and sectors. For example, a Bitcoin ETF tracks Bitcoin’s price. ETF is a tool used by investors to gain exposure to a certain asset.
Yes. The first Bitcoin futures ETF in the US was approved by the US Securities & Exchange Commission in October 2021. A total of seven Bitcoin futures ETFs have been approved, with more than 20 still waiting for the regulator’s permission. The SEC says that the cryptocurrency industry is new and subject to manipulation, which is why it has been delaying crypto-related futures ETFs for the last few years.
Yes. The SEC approved in January 2024 the listing and trading of several Bitcoin spot Exchange-Traded Funds, opening the door to institutional capital and mainstream investors to trade the main crypto currency. The decision was hailed by the industry as a game changer.
The main advantage of crypto ETFs is the possibility of gaining exposure to a cryptocurrency without ownership, reducing the risk and cost of holding the asset. Other pros are a lower learning curve and higher security for investors since ETFs take charge of securing the underlying asset holdings. As for the main drawbacks, the main one is that as an investor you can’t have direct ownership of the asset, or, as they say in crypto, “not your keys, not your coins.” Other disadvantages are higher costs associated with holding crypto since ETFs charge fees for active management. Finally, even though investing in ETFs reduces the risk of holding an asset, price swings in the underlying cryptocurrency are likely to be reflected in the investment vehicle too.
Recommended Articles


