

Top Altcoins Price Forecast: Ripple, Cardano, Solana – XRP, ADA face downside risk as SOL consolidates

Source Fxstreet
  • XRP stalls near $1.29 on Tuesday, below key EMAs, as momentum remains weak and nearly 10% downside risk looms.
  • Cardano trades below $0.2200, extending the bearish breakout move of a rising trendline.
  • Solana continues to consolidate above $100, with the price capped by the 50-day EMA near $106.

Top altcoins, including Ripple (XRP), Cardano (ADA), and Solana (SOL), stall on Tuesday after a bearish week, suggesting a brief pause in selling pressure. The technical outlook for XRP and ADA indicates a downside bias, while SOL shows mixed signals, with the price holding above $100 as momentum eases.

Ripple's bearish breakout flags 10% downside

Ripple trades at $1.2974 at press time on Tuesday, keeping a bearish near-term tone. XRP price sits well below the 50-day Exponential Moving Average (EMA) at $1.3750 and the 200-day EMA at $1.3950.

From a technical perspective, XRP stabilizes the prevailing correction phase near the June 15 high at $1.2941 but remains capped below the broken support trendline near $1.3500. A confirmed breakout below $1.2941 could extend the decline toward the June 8 high at $1.1866.

Momentum indicators on the daily chart reinforce the downside bias, with the Moving Average Convergence Divergence (MACD) holding below zero and the Relative Strength Index (14) hovering near 36, close to oversold territory.

Chart Analysis XRP/USDT (Binance)
XRP/USDT daily price chart.

On the topside, initial resistance appears at the 50-day EMA at $1.3750, followed by the 200-day EMA at $1.39500, together defining a dense supply zone overhead.

Bearish reversal in Cardano gains momentum

Cardano trades at $0.2169, extending a downward trend after breaking below its rising support trendline, which connected the July 28 and August 19 lows, near $0.2329. The ADA price holds both the 50-day EMA at $0.2284 and the 200-day EMA at $0.2435.

The MACD edges below the zero line, capped by its signal line, while the RSI is at 39, both hinting at persistent downside pressure rather than an imminent recovery.

Looking down, the path of least resistance highlights the August 30 low at $0.1894, projecting a downside potential of over 10%.
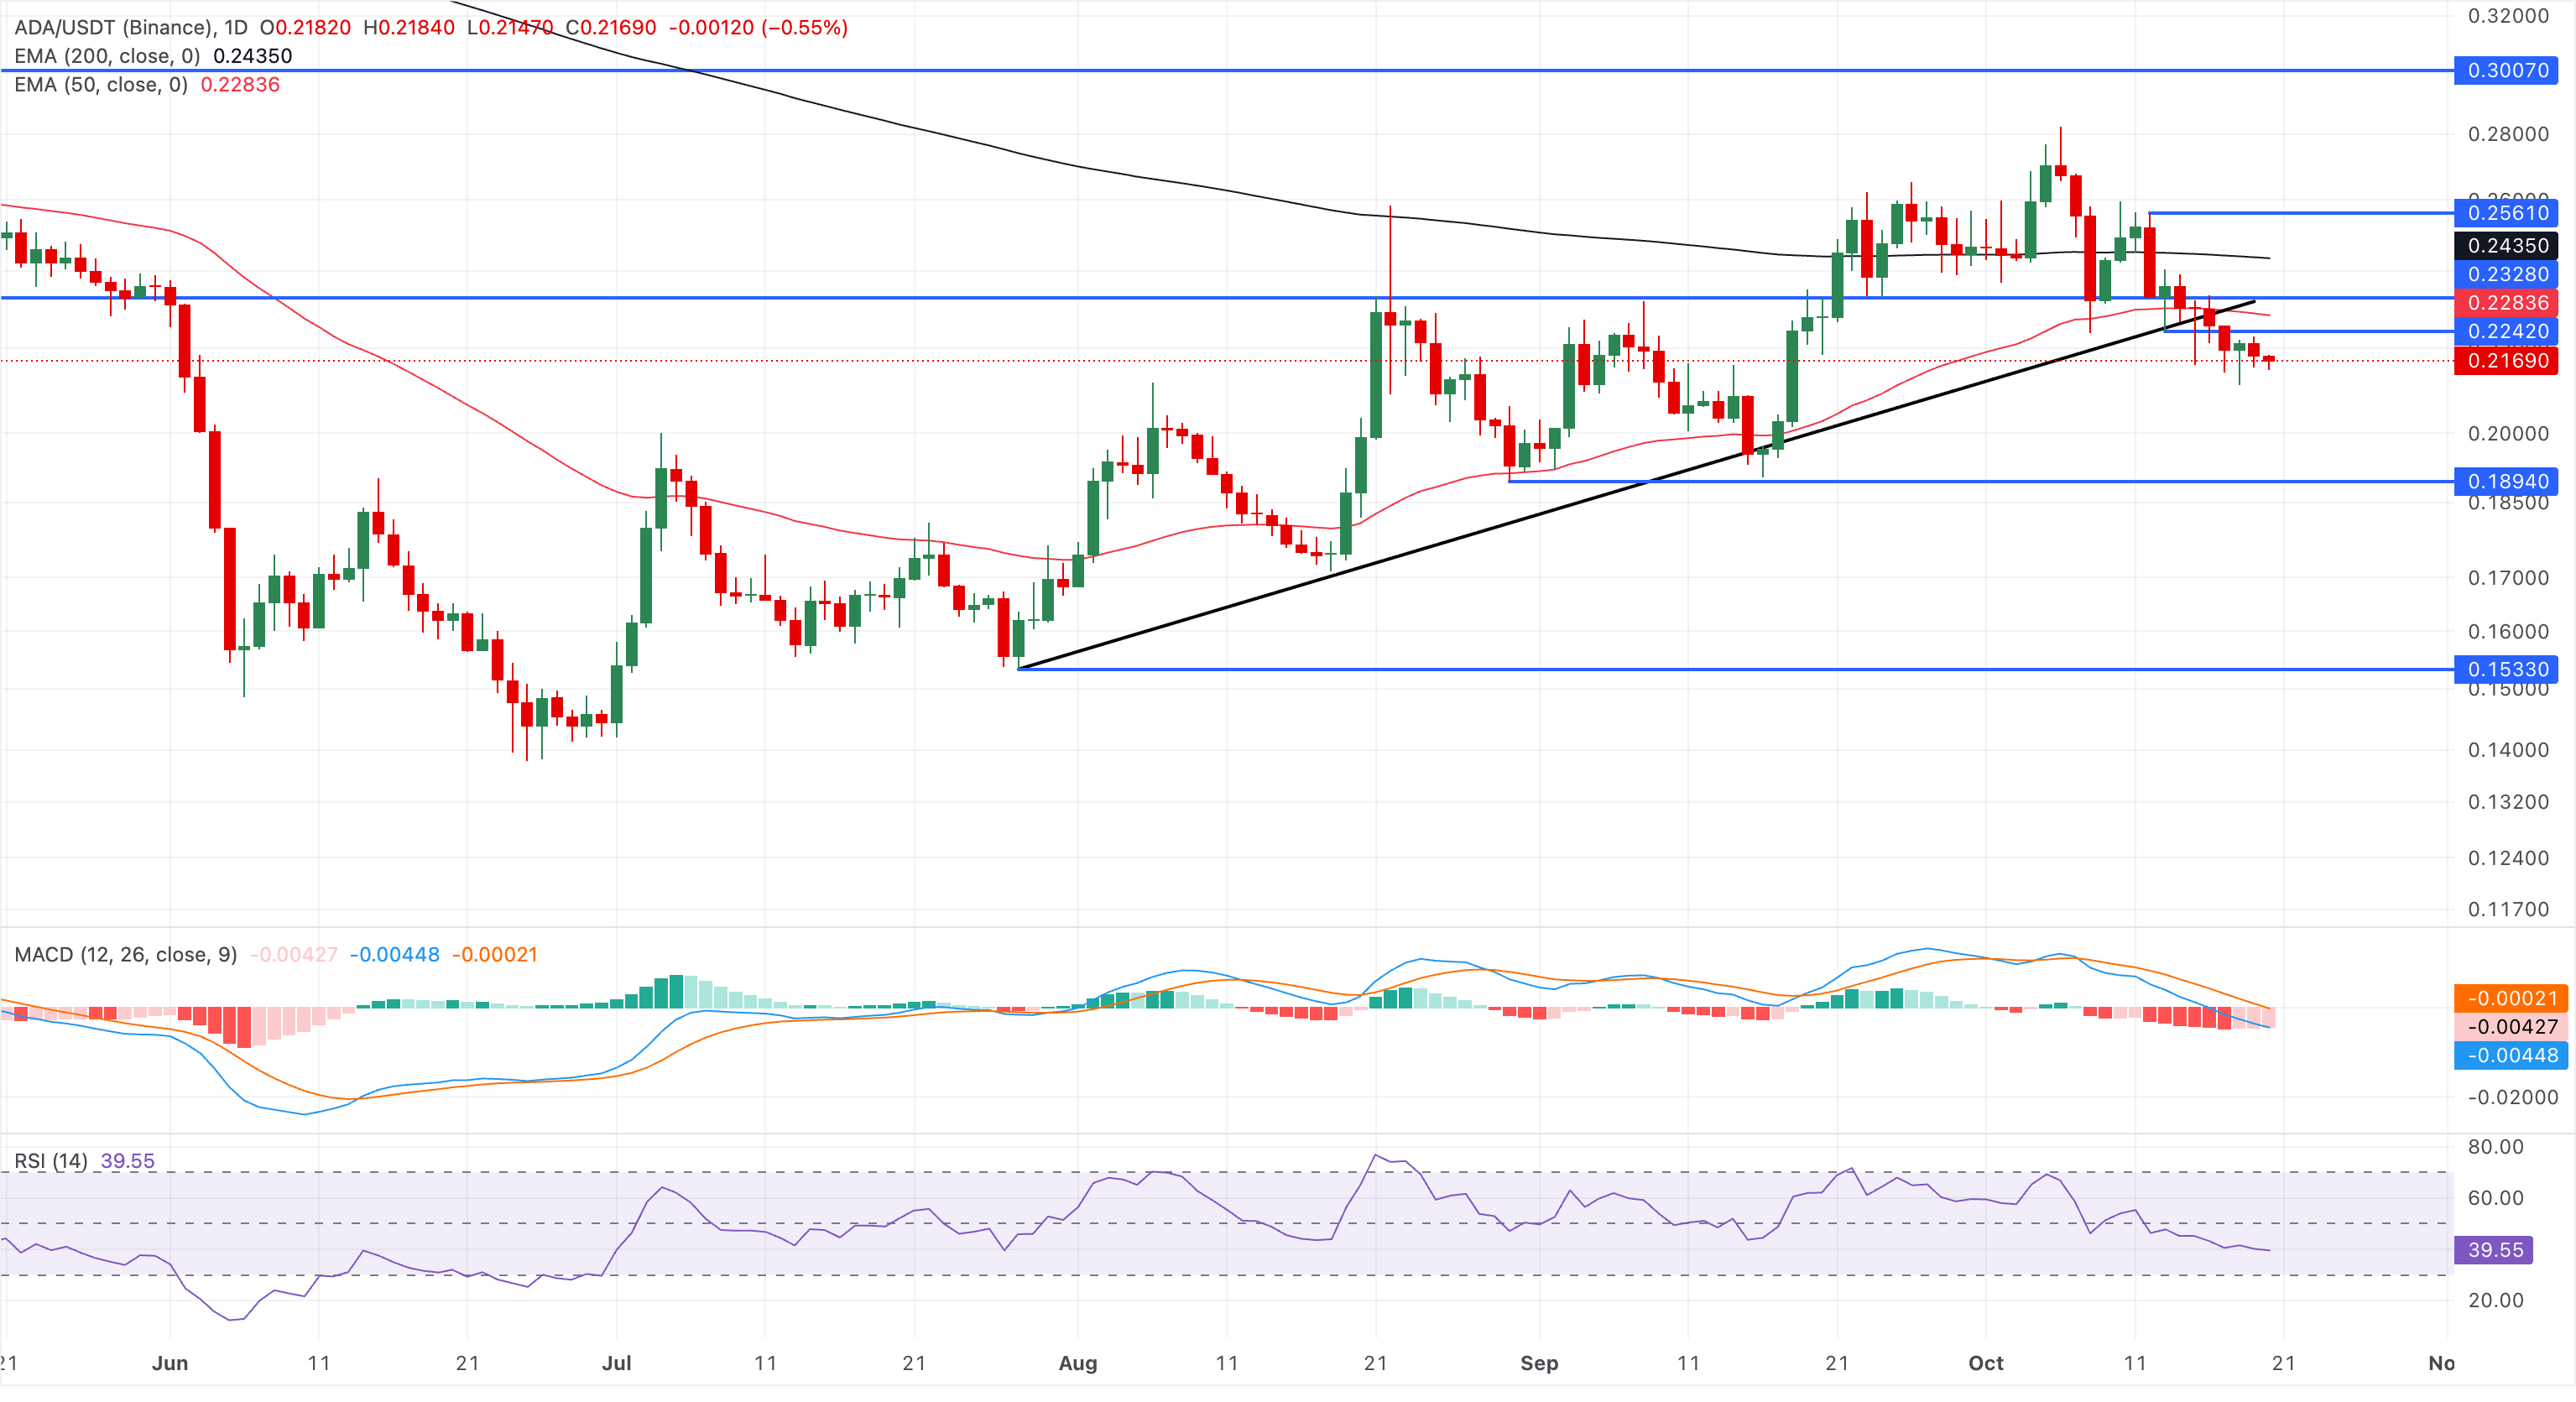
ADA/USDT daily price chart.

The initial resistance is seen at the 50-day EMA at $0.2284, followed by the former rising trendline at $0.2329, before the heavier supply zone defined by the 200-day EMA at $0.2435.

Solana is above $100, but capped by the 50-day EMA

Solana hovers around $100, maintaining a bearish near‑term tone as it remains below the 50‑day EMA at $106.73 and holds only modestly above the 200‑day EMA at $98.61. This configuration suggests the pair is consolidating in a corrective phase within a broader uptrend.

Momentum indicators reaffirm the prevailing downside risks, with the MACD and signal line below zero and the RSI at 40, hinting at persistent downside pressure.

A confirmed breakout above the 50‑day EMA at $106.73 and a sustained break above this barrier would be needed to ease immediate downside pressure before any potential approach toward the August 27 high at $110.60, followed by the $122.94 peak set on September 25.
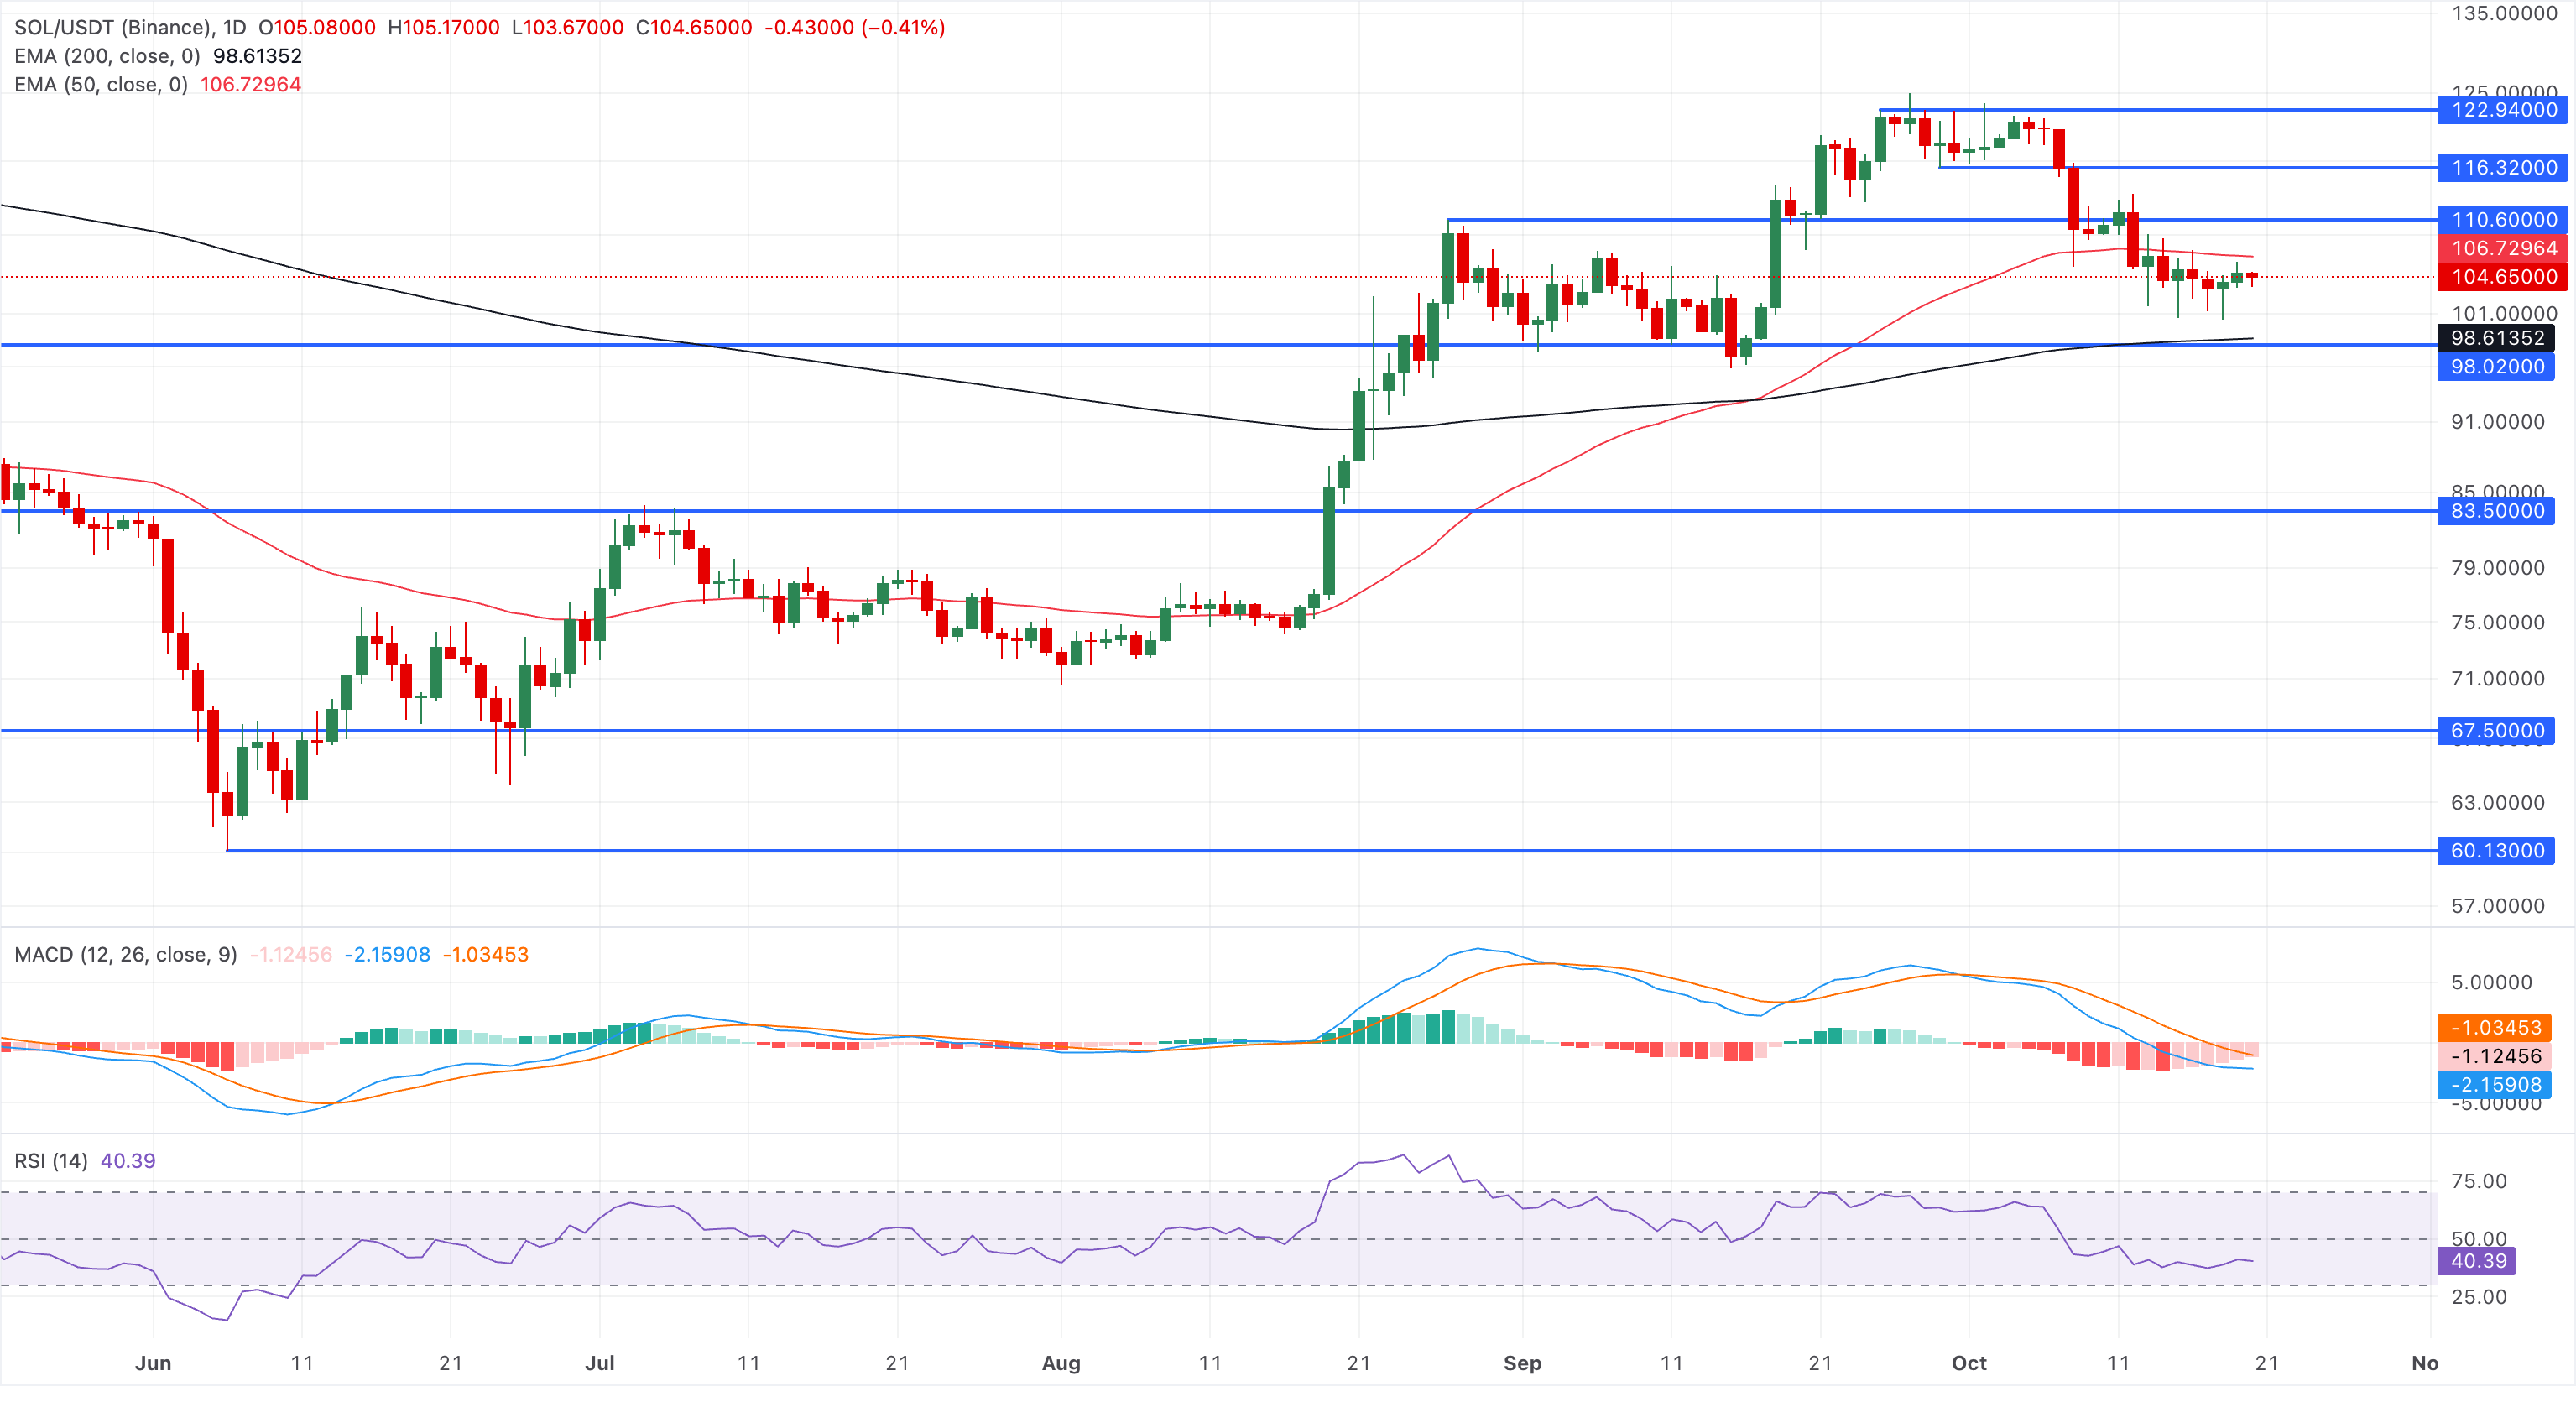
SOL/USDT daily price chart.

Looking down, the $100 psychological level and the 200-day EMA at $98.61 form immediate support, and a deeper pullback could potentially extend the decline toward the May 17 high at $83.50.

(The technical analysis of this story was written with the help of an AI tool. Know more.)

Disclaimer: For information purposes only. Past performance is not indicative of future results.
placeholder
Today’s Market Recap: U.S. Stocks Rebound as Nasdaq Gains 1.11%, Memory Chip Stocks Rally, SanDisk Jumps 5.5%U.S. stocks rebounded on Monday, October 19, following a sharp sell-off in AI infrastructure stocks last week, lifting the Nasdaq Composite and S&P 500.At the clo
Author  TradingKey
Yesterday 01: 25
U.S. stocks rebounded on Monday, October 19, following a sharp sell-off in AI infrastructure stocks last week, lifting the Nasdaq Composite and S&P 500.At the clo
placeholder
Dollar presses 102 as the 10-year yield sits at 5.14% — and October hike odds are only 17%The dollar index closed at 101.99 (+0.20%) on Monday after briefly topping 102.07, while the 10-year Treasury yield rose to 5.14% and the 2-year hit 4.774% — yet futures price only about a 17% chance of a hike at the October 27-28 FOMC, versus roughly 90% for December. The driver is a global bond selloff, not a Fed repricing: France's 10-year OAT jumped to 4.84% ~ 4.94% and the OAT-Bund spread widened to 140 ~ 146bp. Here are the levels, the cross-asset read-through and what to watch.
Author  Irene Q.
Yesterday 05: 50
The dollar index closed at 101.99 (+0.20%) on Monday after briefly topping 102.07, while the 10-year Treasury yield rose to 5.14% and the 2-year hit 4.774% — yet futures price only about a 17% chance of a hike at the October 27-28 FOMC, versus roughly 90% for December. The driver is a global bond selloff, not a Fed repricing: France's 10-year OAT jumped to 4.84% ~ 4.94% and the OAT-Bund spread widened to 140 ~ 146bp. Here are the levels, the cross-asset read-through and what to watch.
placeholder
Netflix earnings land tonight: the $70 line that decides whether the AI rebound has legsNetflix reports Q3 after the US close on October 20 with the stock at $69.85 (-0.96%), just below the $70 round number and far from its 52-week high of $124.86. Consensus looks for revenue near $12.87bn (+12%), EPS around $0.82 and a 33.2% operating margin, while options imply an 8.4% one-day move. With the Nasdaq up 1.11% and the SOX up 1.61% after an eight-day slide, the result is the first real test of the AI-led rebound. Here are the numbers, the $65 / $70 / $75 levels and the three checks that matter.
Author  Irene Q.
Yesterday 06: 25
Netflix reports Q3 after the US close on October 20 with the stock at $69.85 (-0.96%), just below the $70 round number and far from its 52-week high of $124.86. Consensus looks for revenue near $12.87bn (+12%), EPS around $0.82 and a 33.2% operating margin, while options imply an 8.4% one-day move. With the Nasdaq up 1.11% and the SOX up 1.61% after an eight-day slide, the result is the first real test of the AI-led rebound. Here are the numbers, the $65 / $70 / $75 levels and the three checks that matter.
placeholder
Tesla Q3 Earnings Preview: Can Auto Margins Stabilize? Wall Street’s Highest Price Target at $550Tesla (TSLA) will report its third-quarter 2026 financial results after the U.S. stock market close on October 21, Eastern Time, and host an earnings conference call at 17:30 that day. Th
Author  TradingKey
22 hours ago
Tesla (TSLA) will report its third-quarter 2026 financial results after the U.S. stock market close on October 21, Eastern Time, and host an earnings conference call at 17:30 that day. Th
placeholder
Gold Price Analysis Today | Forex Gold Analysis | XAU/USD Analysis - October 21, 2026Get the latest gold price analysis, forex gold insights, and XAU/USD analysis for October 21, 2026. Read on for the details.
Author  Mitrade
6 hours ago
Get the latest gold price analysis, forex gold insights, and XAU/USD analysis for October 21, 2026. Read on for the details.
goTop
quote