

Solana Price Forecast: SOL reclaims 50-day EMA amid tokenization expansion

Source Fxstreet
  • Solana recovers, trading above the 50-day EMA around $107 on Tuesday after closing below it the previous day.
  • Solana announces the onchain tokenization of USDGO Plus SP and the launch of Pando Solana ETF.
  • US-listed spot ETFs recorded an outflow of $699,830 on Monday, marking the sixth consecutive day of withdrawals.

Solana (SOL) trades above $107 on Tuesday, reclaiming the 50-day Exponential Moving Average (EMA) after closing below it the previous day. Meanwhile, Solana’s tokenization expansion and the upcoming listing of Hong Kong’s second spot Solana Exchange Traded Fund (ETF) highlight growing institutional interest. However, persistent outflows from spot SOL ETFs, which recorded their sixth consecutive day of withdrawals on Monday, could weigh on its recovery.

Tokenization expansion and Hong Kong ETF launch

Solana announced on its official X account on Monday the onchain tokenization of USDGO Plus SP.

“The first market-neutral digital asset fund built on USDGO, the $1B+ US federally regulated stablecoin. Tokenized and distributed by OSL for eligible professional investors in Hong Kong,” as per Solana post on X.

On the same day, Solana announced that a second spot Solana ETF is coming to Hong Kong. Pando Solana ETF is set to list on HKEX on Tuesday. 

These developments highlight Solana’s expanding institutional presence, as tokenization initiatives and new investment products strengthen its footprint in Hong Kong’s digital asset market and reinforce its long-term bullish outlook.

Institutional demand shows cautious signs

SoSoValue data showed that spot ETF recorded an outflow of $699,830 on Monday, marking the sixth consecutive day of withdrawals. However, Monday’s outflow intensity remains small compared to the previous week, indicating reduced selling pressure. If these flows turn positive and gain momentum throughout the week, SOL could extend the recovery.
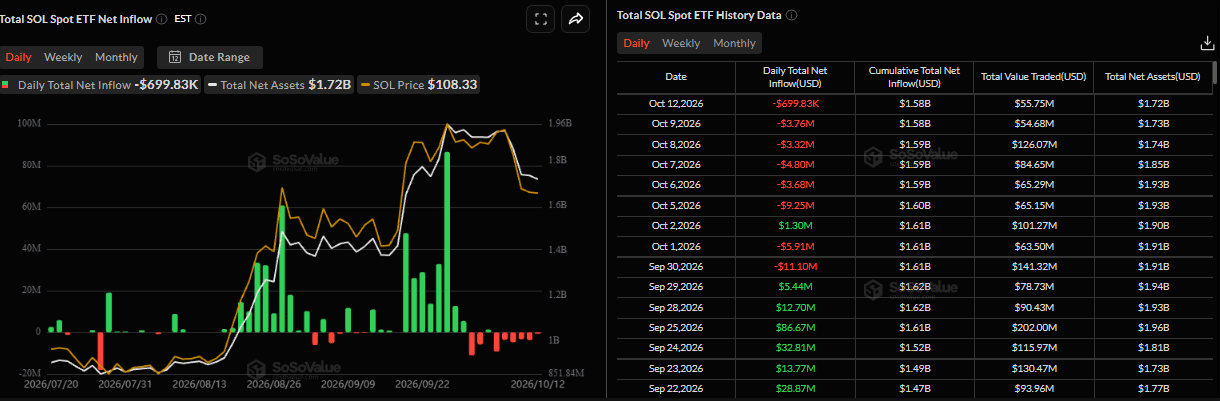
Total SOL spot ETF net inflow daily chart. Source: SoSoValue

Solana Price Forecast: SOL could extend rebound if 50-day EMA holds strong

Solana price trades at $107.86 on Tuesday, holding a constructive near-term bias as it remains above the 50-day Exponential Moving Average (EMA) at $107.49 and comfortably supported by the 100-day EMA at $99.34 and the 200-day EMA at $97.18.

Despite this supportive structure, momentum has cooled, with the Relative Strength Index (RSI) hovering near 42 and the Moving Average Convergence Divergence (MACD) below zero, suggesting a consolidative phase rather than an immediate continuation of the latest advance.

On the downside, initial support aligns with the 50-day EMA at $107.49, followed by a more robust demand zone around the 100-day EMA at $99.34 and the 200-day EMA at $97.18, reinforced by horizontal support near $96.19.

Deeper pullbacks would expose the rising trendline support around $84.82 ahead of the prior horizontal floor at $77.07. At the same time, the lack of nearby mapped resistance suggests that any sustained recovery above the current pivot could quickly reopen the path toward recent highs, as long as price holds over the clustered moving-average base.
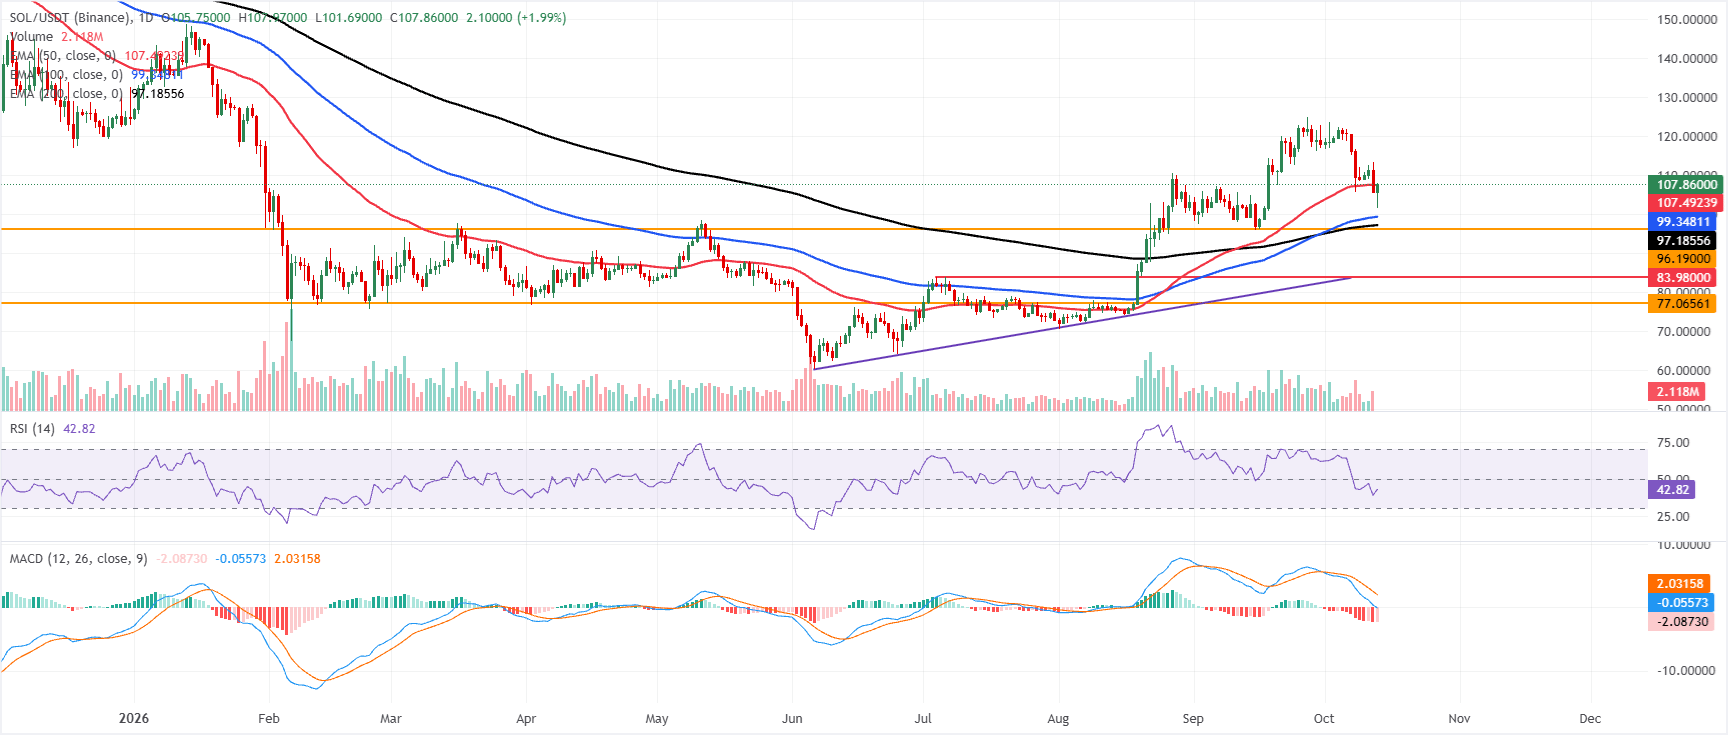
SOL/USDT daily chart

(The technical analysis of this story was written with the help of an AI tool. Know more.)

Disclaimer: For information purposes only. Past performance is not indicative of future results.
placeholder
Strong profits, falling shares: bank earnings day one meets a memory-chip rout — with CPI and ASML aheadGoldman Sachs blew past estimates (EPS $17.01 vs $13.09 expected, profit +33%) while JPMorgan missed ($5.75 vs $5.93) and Wells Fargo fell 3% — yet the S&P 500 finished flat at 7,805.45, pinned below its record close as a memory-chip rout (SOX −2.67%, Micron under $1,000) kept the pressure on. Tonight brings the week's decider: US September CPI at 8:30 ET, then Bank of America, Morgan Stanley, BlackRock and ASML before the open. Here are the levels, both cases, and the watch list.
Author  Irene Q.
Oct 14, Wed
Goldman Sachs blew past estimates (EPS $17.01 vs $13.09 expected, profit +33%) while JPMorgan missed ($5.75 vs $5.93) and Wells Fargo fell 3% — yet the S&P 500 finished flat at 7,805.45, pinned below its record close as a memory-chip rout (SOX −2.67%, Micron under $1,000) kept the pressure on. Tonight brings the week's decider: US September CPI at 8:30 ET, then Bank of America, Morgan Stanley, BlackRock and ASML before the open. Here are the levels, both cases, and the watch list.
placeholder
US September CPI recap: inflation hits 3.7% as core runs hot — is an October Fed hike back on the table?September CPI landed hot: headline 3.7% y/y, core 2.6% y/y and 0.3% m/m. October hike odds jumped from ~22% to ~37% — yet the dollar faded to 101.74, gold closed higher and the S&P 500 fell 1.11%. Here is the full repricing, the levels and what to watch next.
Author  Irene Q.
Oct 15, Thu
September CPI landed hot: headline 3.7% y/y, core 2.6% y/y and 0.3% m/m. October hike odds jumped from ~22% to ~37% — yet the dollar faded to 101.74, gold closed higher and the S&P 500 fell 1.11%. Here is the full repricing, the levels and what to watch next.
placeholder
Gold Price Analysis Today | Forex Gold Analysis | XAU/USD Analysis - October 15, 2026Get the latest gold price analysis, forex gold insights, and XAU/USD analysis for October 15, 2026. Read on for the details.
Author  Mitrade
19 hours ago
Get the latest gold price analysis, forex gold insights, and XAU/USD analysis for October 15, 2026. Read on for the details.
placeholder
Today’s Market Recap: U.S. Stocks Rebound, Dow Jumps Over 1%, Micron Gains 1.87%, CoreWeave Rallies Nearly 6%Tracking the Market TrendTradingKey - On October 15, Eastern Time, U.S. September PPI data posted its largest monthly and annual gains since 2022, prompting investors to shift from AI tech stocks to d
Author  TradingKey
Yesterday 01: 20
Tracking the Market TrendTradingKey - On October 15, Eastern Time, U.S. September PPI data posted its largest monthly and annual gains since 2022, prompting investors to shift from AI tech stocks to d
placeholder
Gold Price Analysis Today | Forex Gold Analysis | XAU/USD Analysis - October 16, 2026Get the latest gold price analysis, forex gold insights, and XAU/USD analysis for October 16, 2026. Read on for the details.
Author  Mitrade
19 hours ago
Get the latest gold price analysis, forex gold insights, and XAU/USD analysis for October 16, 2026. Read on for the details.
Related Instrument
goTop
quote