

Litecoin Price Forecast: LTC poised for an extended $60-bound breakout

Source Fxstreet
  • Litecoin reaffirms its short-term bullish outlook after reclaiming the 200-day EMA as support.
  • Retail demand remains elevated, with perpetual futures Open Interest at 7.5 million LTC amid a positive weighted funding rate.
  • Litecoin downside remains broadly supported, but short-term breakouts depend on steady momentum indicators.

Litecoin (LTC) extends its gains on Friday, exchanging hands at $55.00. The 28th-largest cryptocurrency, with a market capitalization of $4.3 billion, has notched a third straight session of recovery from the critical $50.00 support zone.

Continued momentum here could pave the way for a decisive breakout above $60.00, reinforced by a strong cluster of moving averages.

Retail demand props Litecoin gains

Litecoin derivatives market remains steady, attracting 7.5 million LTC in perpetual futures Open Interest (OI) on Friday, up from 7.4 million LTC the day before. More broadly, the metric has steadily recovered in recent months, underscoring growing appetite for risk assets.
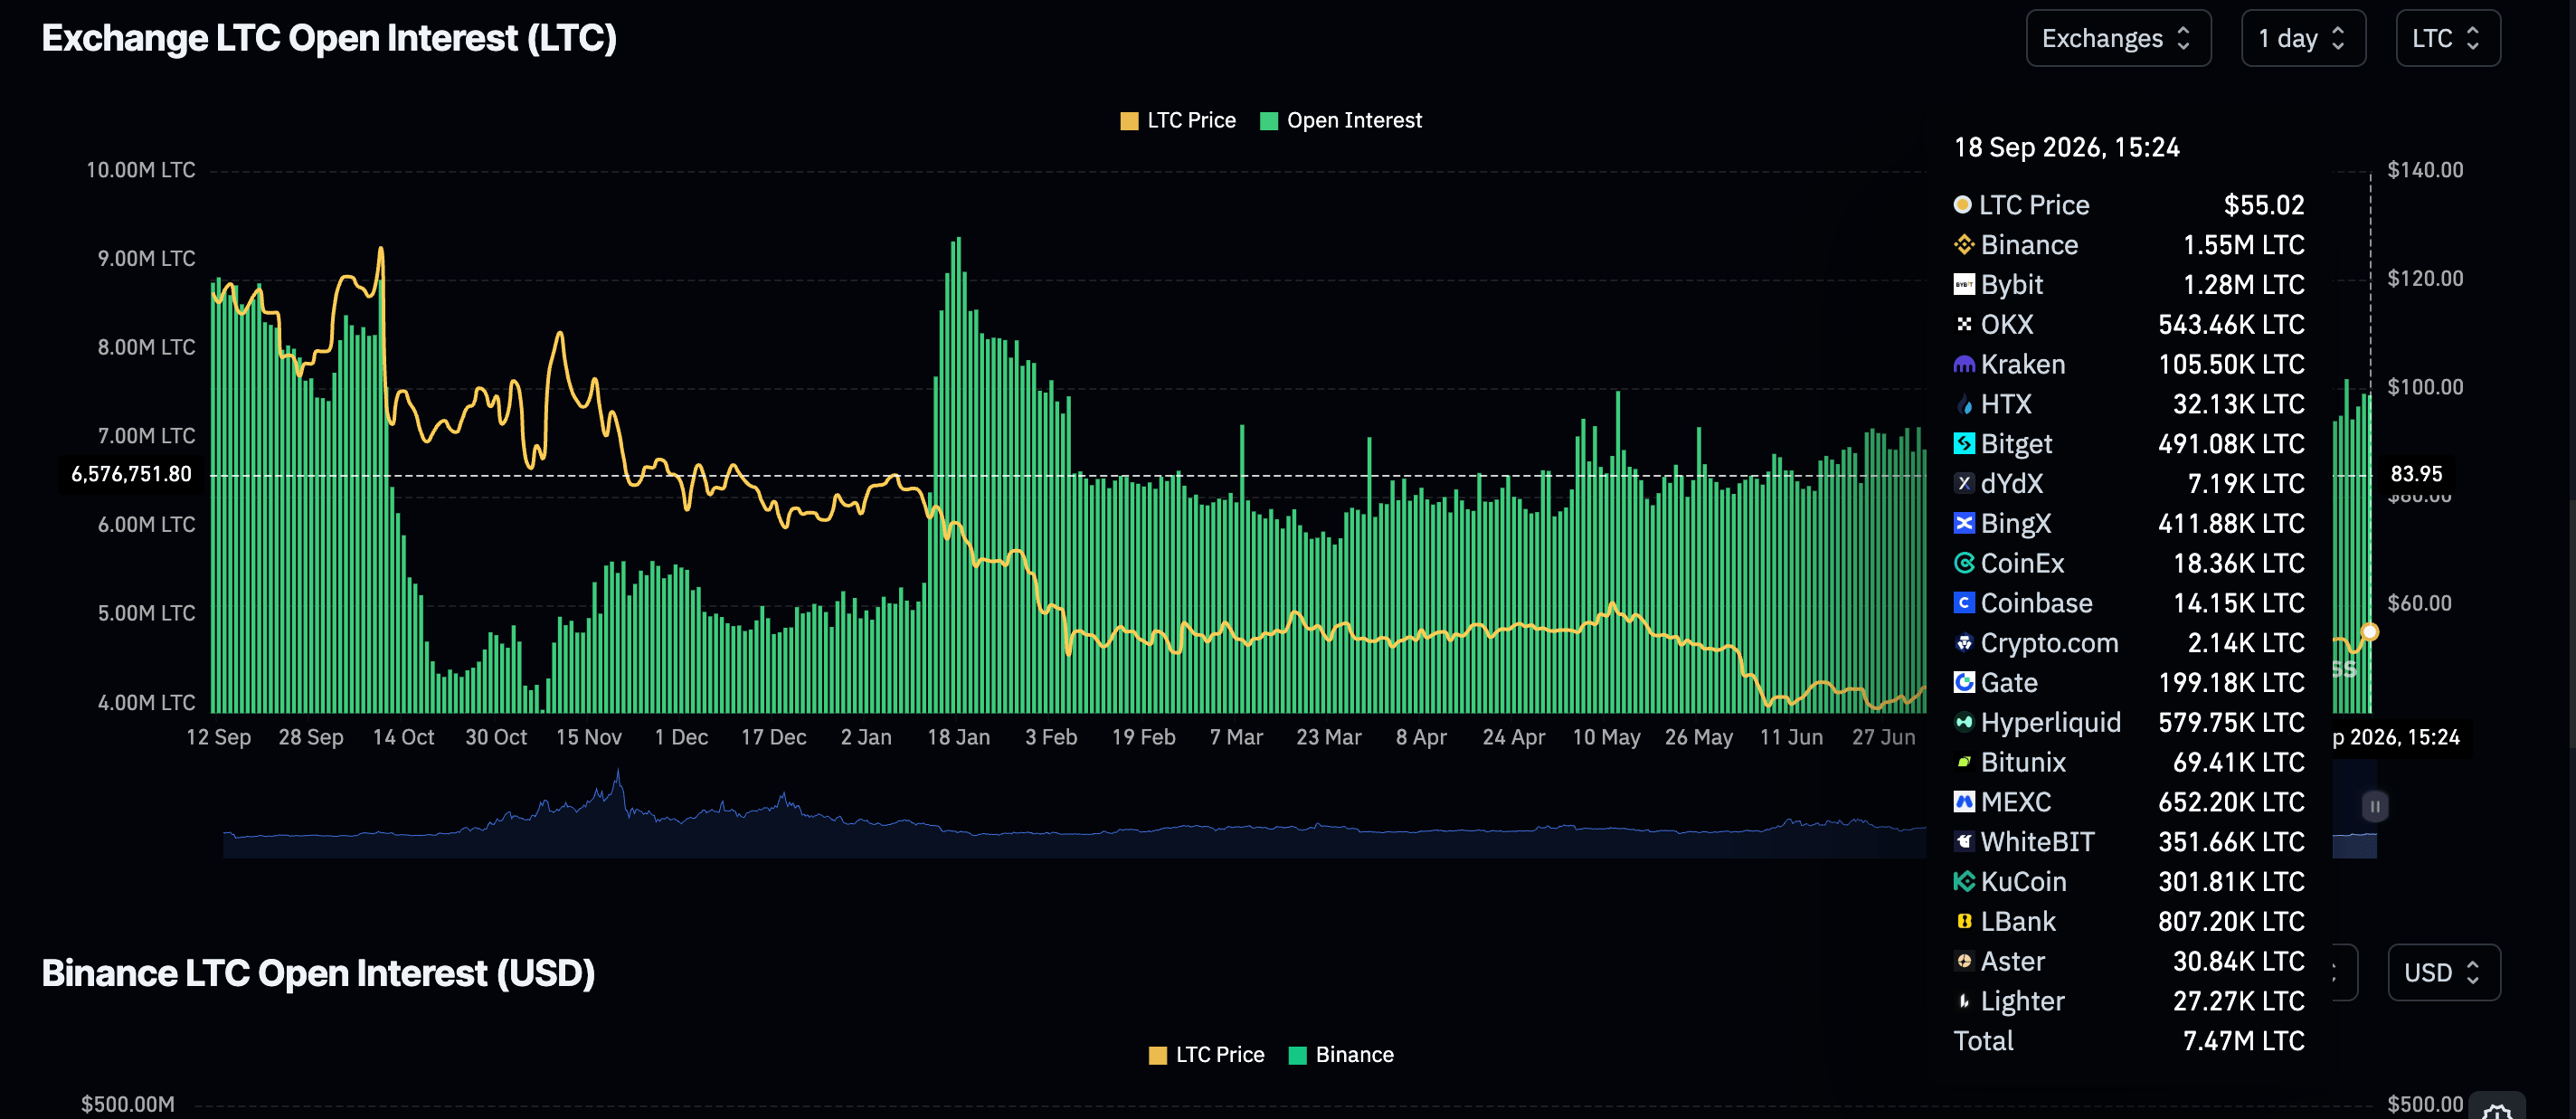
LTC Futures OI | Source: CoinGlass

Moreover, Litecoin OI-weighted funding rate remains positive, indicating bulls are willing to pay a premium in fees to keep their long positions open, anticipating a potential move above $60.00.
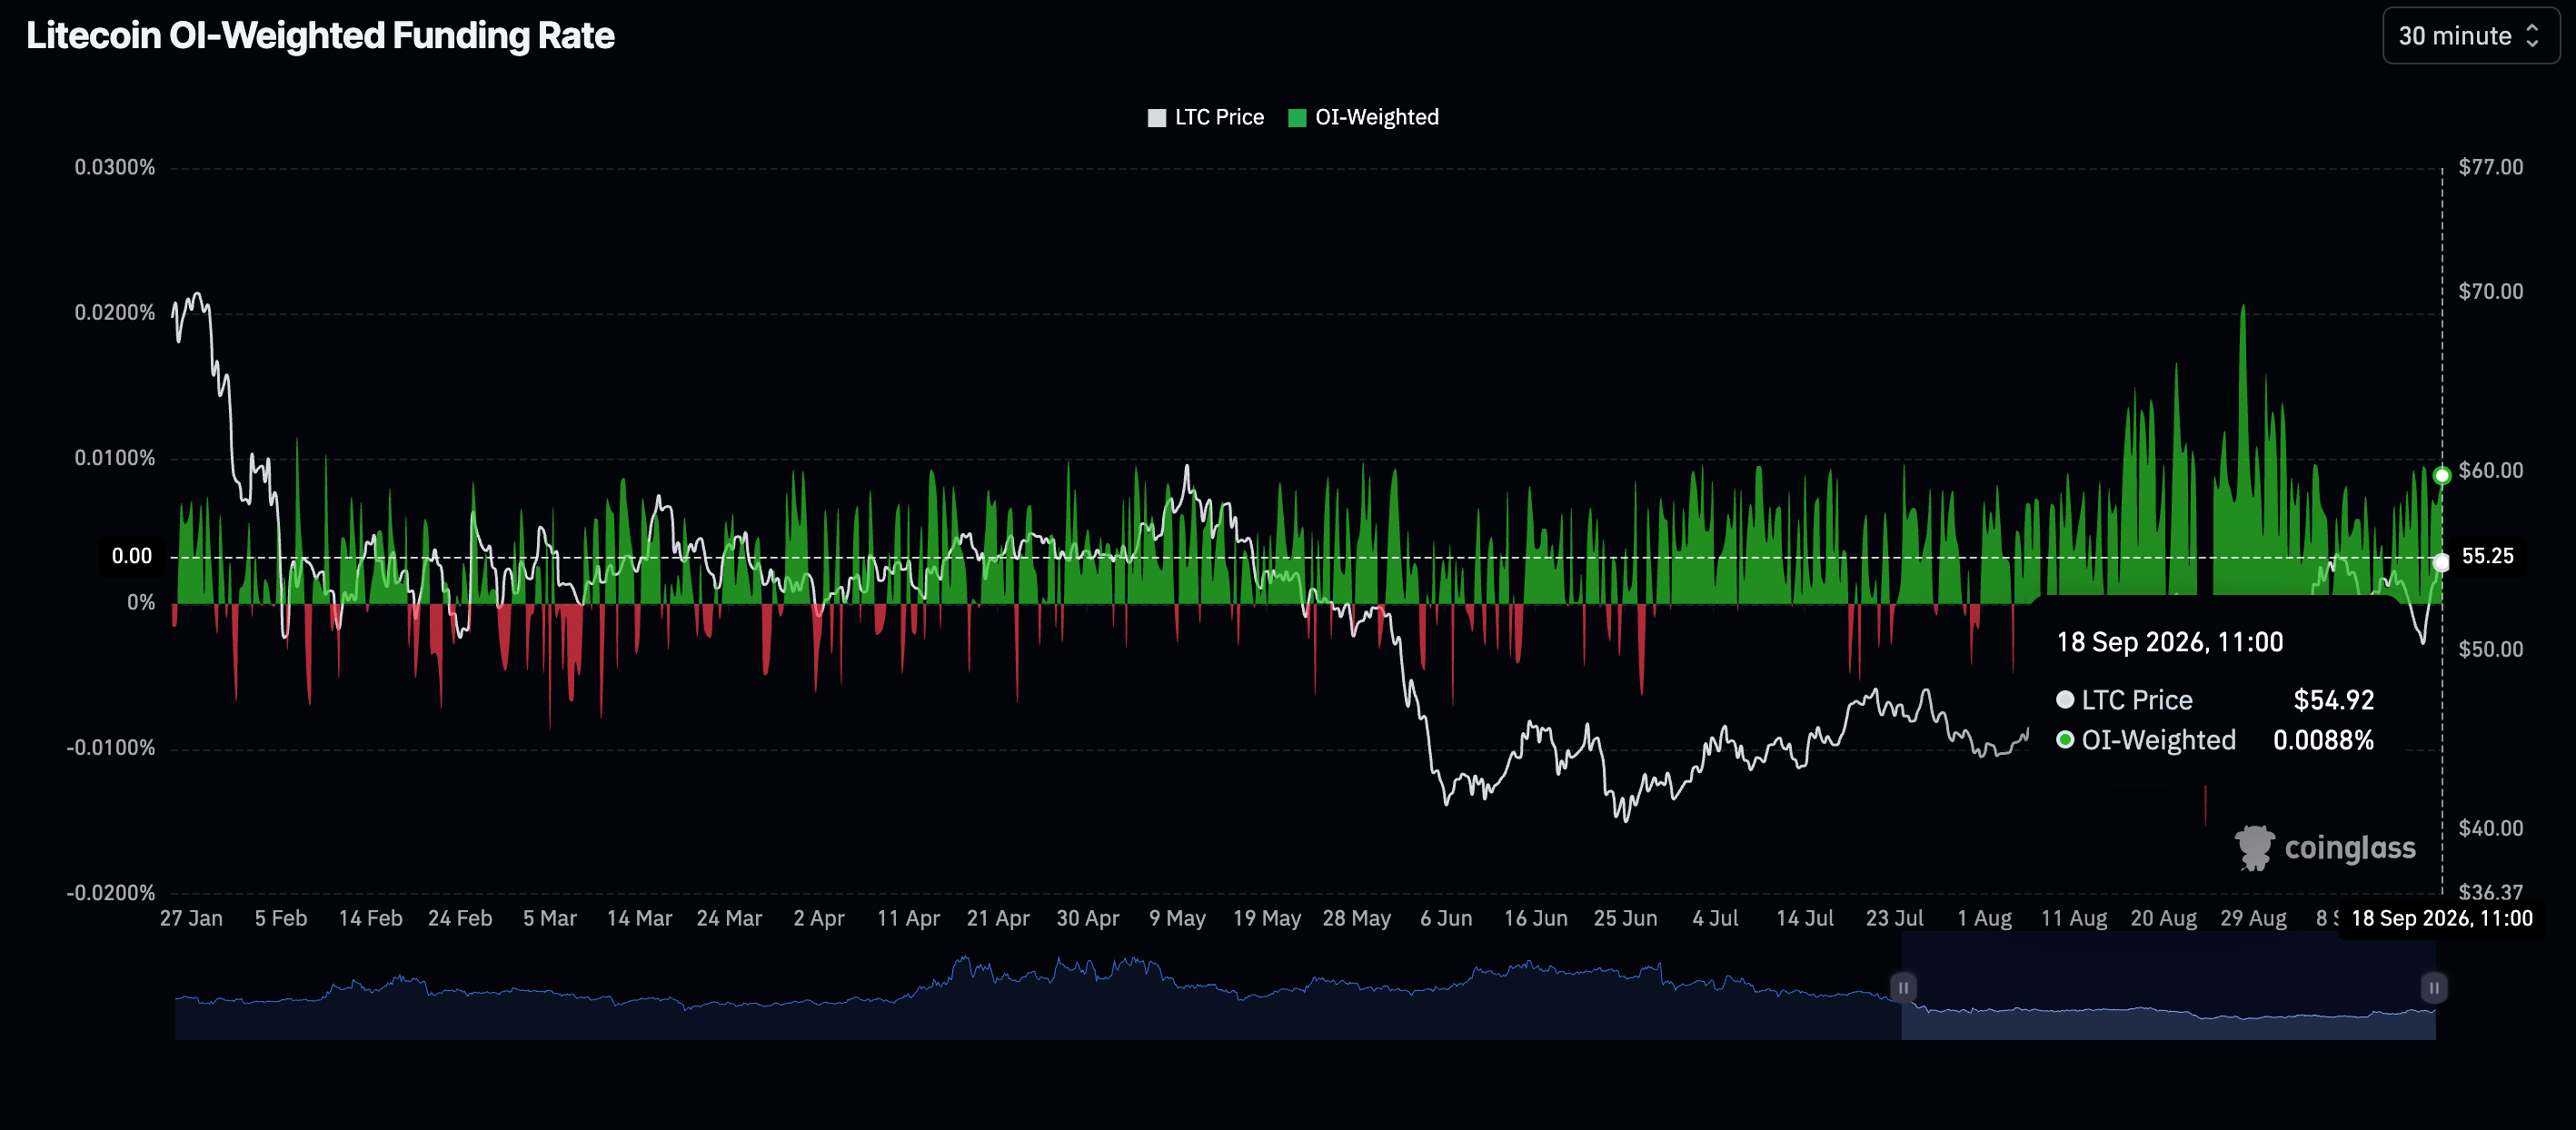
LTC OI-Weighted Funding Rate | Source: CoinGlass

Technical analysis: Litecoin bulls tighten grip as price ticks up

Litecoin trades at $55.00, maintaining a constructive bullish bias as price stays above key Exponential Moving Averages (EMAs). The 50-day EMA at $50.18, the 100-day EMA at $49.49 and the 200-day EMA at $53.52 all sit below spot, suggesting an underlying supportive trend structure.

Still, the Moving Average Convergence Divergence (MACD) is turning negative and hinting at waning momentum. The Relative Strength Index (RSI) near 63 stays in positive territory without reaching overbought conditions, reinforcing the idea of a still upwardly biased but moderating advance.
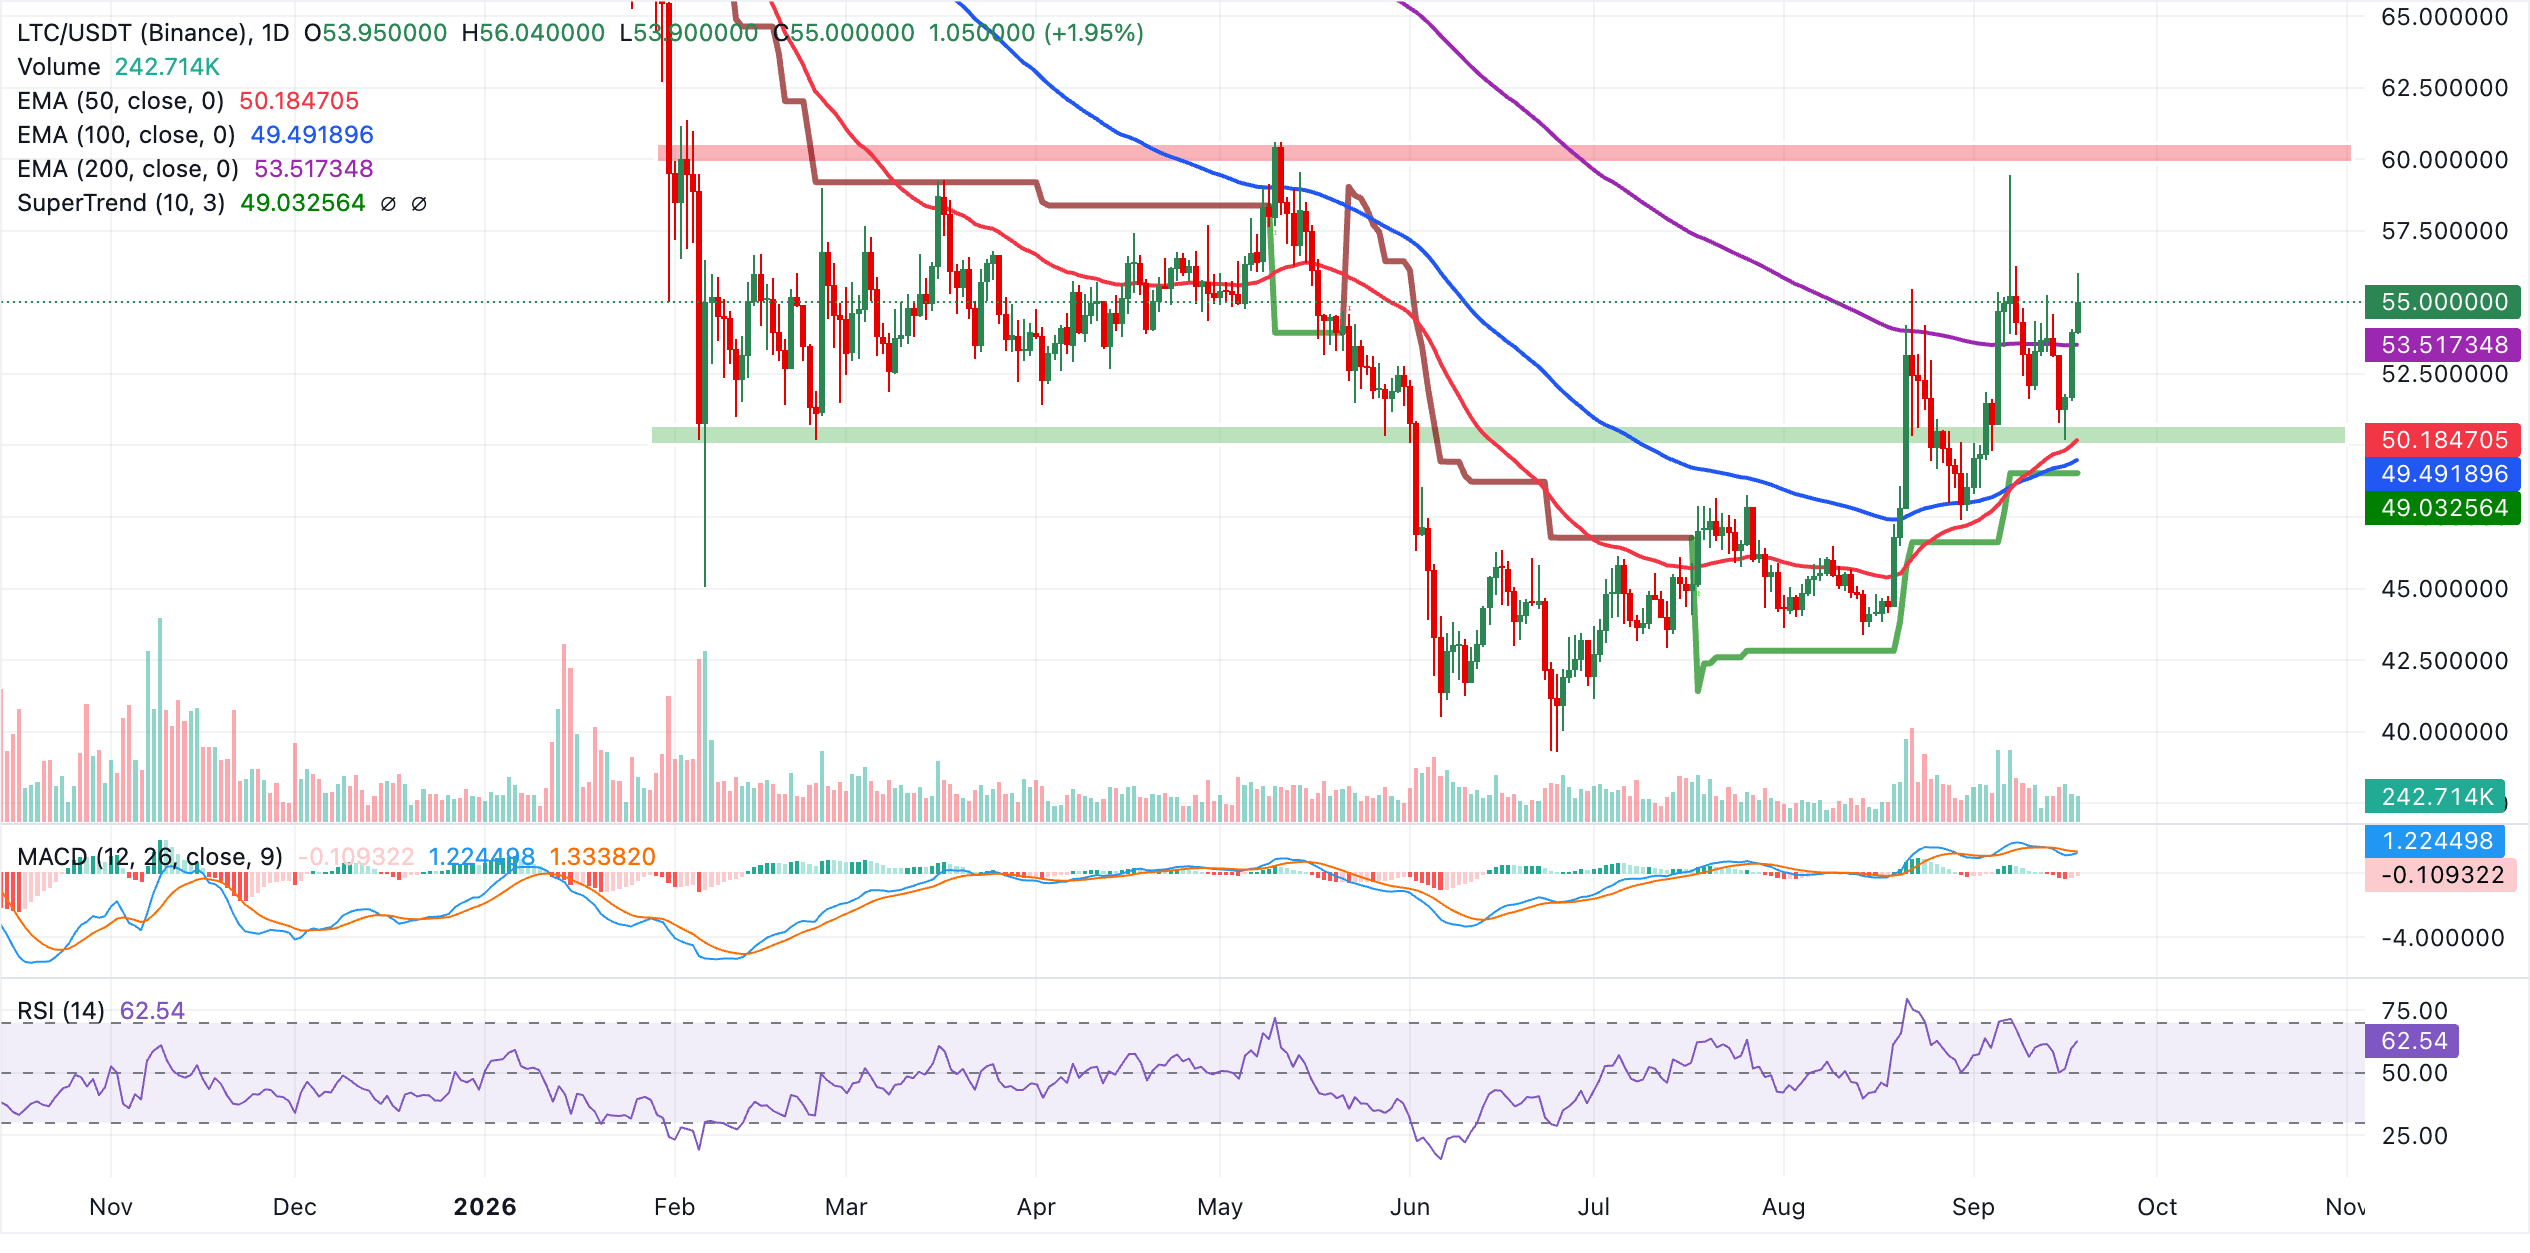
LTC/USDT daily chart

On the downside, initial demand is seen at the 200-day EMA near $53.52, ahead of the 50-day EMA at $50.18 and the 100-day EMA at $49.49, which form a broader support band on deeper pullbacks. On the topside, the SuperTrend line at $49.03 now lies well below the current price and does not cap the market in the near term, leaving LTC focused on whether it can hold above the clustered EMAs to preserve the current bullish tone for a breakout beyond $60.00.

(The technical analysis of this story was written with the help of an AI tool. Know more.)

Open Interest, funding rate FAQs

Higher Open Interest is associated with higher liquidity and new capital inflow to the market. This is considered the equivalent of increase in efficiency and the ongoing trend continues. When Open Interest decreases, it is considered a sign of liquidation in the market, investors are leaving and the overall demand for an asset is on a decline, fueling a bearish sentiment among investors.

Funding fees bridge the difference between spot prices and prices of futures contracts of an asset by increasing liquidation risks faced by traders. A consistently high and positive funding rate implies there is a bullish sentiment among market participants and there is an expectation of a price hike. A consistently negative funding rate for an asset implies a bearish sentiment, indicating that traders expect the cryptocurrency’s price to fall and a bearish trend reversal is likely to occur.

Disclaimer: For information purposes only. Past performance is not indicative of future results.
placeholder
Have Fed Rate Hike Headwinds Been Priced In? Gold Rebounds Strongly Toward $4,400, Poised for a New Rally As of the European session on September 18, gold prices (XAUUSD) extended Thursday's rebound, rising strongly in intraday trading to $4,399.75 today, just shy of the $4,400 psychological
Author  TradingKey
6 hours ago
As of the European session on September 18, gold prices (XAUUSD) extended Thursday's rebound, rising strongly in intraday trading to $4,399.75 today, just shy of the $4,400 psychological
placeholder
US to delay new "overcapacity" tariffs on China — what the pause means for trade, inflation and the dollarWashington is expected to hold off announcing new tariffs over Chinese "overcapacity" until after the 24 September summit, according to Bloomberg. The postponed plan would have added 7.5% to Chinese goods, taking second-term US tariffs to around 20%. Here is what is on the table, and what a deal versus no deal would mean for the yuan, Hong Kong equities and the dollar.
Author  Mitrade
8 hours ago
Washington is expected to hold off announcing new tariffs over Chinese "overcapacity" until after the 24 September summit, according to Bloomberg. The postponed plan would have added 7.5% to Chinese goods, taking second-term US tariffs to around 20%. Here is what is on the table, and what a deal versus no deal would mean for the yuan, Hong Kong equities and the dollar.
placeholder
Gold rebounds to near $4,350 on weaker US Dollar, falling oil pricesGold price (XAU/USD) rises to near $4,345 during the early Asian session on Friday. The precious metal rebounds from a six-week low amid falling oil prices and a weaker US Dollar (USD). Traders continue to assess the latest Federal Reserve (Fed) rate hike and policy cues.
Author  FXStreet
15 hours ago
Gold price (XAU/USD) rises to near $4,345 during the early Asian session on Friday. The precious metal rebounds from a six-week low amid falling oil prices and a weaker US Dollar (USD). Traders continue to assess the latest Federal Reserve (Fed) rate hike and policy cues.
placeholder
Crude Oil Price Forecast: Can Brent Hold $100 Amid Hawkish Fed Rate Hikes and Easing Supply Concerns? International oil prices continued to fall after the Federal Reserve resumed rate hikes in September. On Wednesday, WTI crude dropped 3.28% to settle at $102.02 per barrel; Brent crude fe
Author  TradingKey
Yesterday 09: 59
International oil prices continued to fall after the Federal Reserve resumed rate hikes in September. On Wednesday, WTI crude dropped 3.28% to settle at $102.02 per barrel; Brent crude fe
placeholder
Dow drops 631 points as the Fed hikes — but futures are rebounding: what's next for US stocks?The Dow fell 631 points and the S&P 500 closed below 7,600 after the Fed hiked rates for the first time since 2023, with the dot plot showing 16 of 18 officials expect more tightening. Asia-session futures are already recovering — here are the levels and analyst views that decide whether 7,500 holds.
Author  Irene Q.
Yesterday 02: 54
The Dow fell 631 points and the S&P 500 closed below 7,600 after the Fed hiked rates for the first time since 2023, with the dot plot showing 16 of 18 officials expect more tightening. Asia-session futures are already recovering — here are the levels and analyst views that decide whether 7,500 holds.
Related Instrument
goTop
quote