

Shiba Inu Price Forecast: Faces downside risks as whale selling rises

Source Fxstreet
  • Shiba Inu steadies at $0.00000516 on Wednesday, after recovering nearly 4% in the previous two days.
  • Santiment data shows that certain whale wallets are offloading SHIB tokens, raising concerns.
  • Derivatives and on-chain data show cautious signs with rising short bets alongside signs of overheated market conditions.

Shiba Inu (SHIB) trades around $0.00000516 on Wednesday following a rebound of nearly 4% earlier this week. Despite the price recovery, Santiment data shows certain whales offloading SHIB tokens. Meanwhile, weakening derivatives and on-chain data for the meme coin suggest a cautious tone, which could increase the downside risk.

Whales are selling SHIB

Santiment’s Supply Distribution data supports a bearish outlook for Shiba Inu, as large-wallet holders (whales) are reducing exposure after the meme coin’s recent price surge.

The metric indicates that whales holding between 1 million and 10 million (yellow line) and 10 million and 100 million tokens (blue line) have shed 40 billion tokens since August 22.

In the same period, whales holding between 100,000 and 1 million (red line) have accumulated 990 million SHIB. This indicates a shift in positioning among large holders: top-tier whales and mid-sized whales are reducing exposure, signaling potential profit-booking, while small whales are absorbing some supply, often reflecting distribution and adding near-term downside risk for the meme coin.

SHIB supply distribution chart. Source: Santiment

Derivatives and on-chain data show weakening signs

SHIB derivatives metrics and on-chain outlook show a cautious tone. CoinGlass’ long-to-short ratio for the dog-themed meme coin read 0.93 on Wednesday. The ratio being below one, indicates bearish sentiment, as traders are betting the asset’s price will fall.
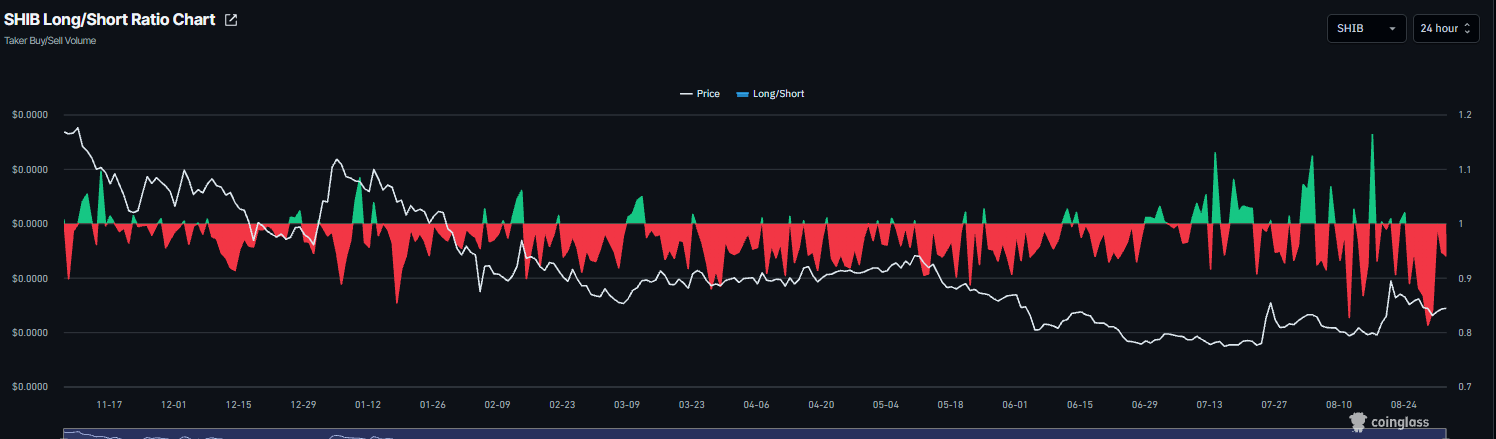
Shiba Inu long-to-short ratio chart Source: Coinglass

CryptoQuant’s summary data also shows bearish bias. SHIB’s spot and futures markets show heating market conditions, while futures markets show large whale orders after the recent price surge. Other metrics remain neutral, highlighting a mixed and cautious sentiment among traders.
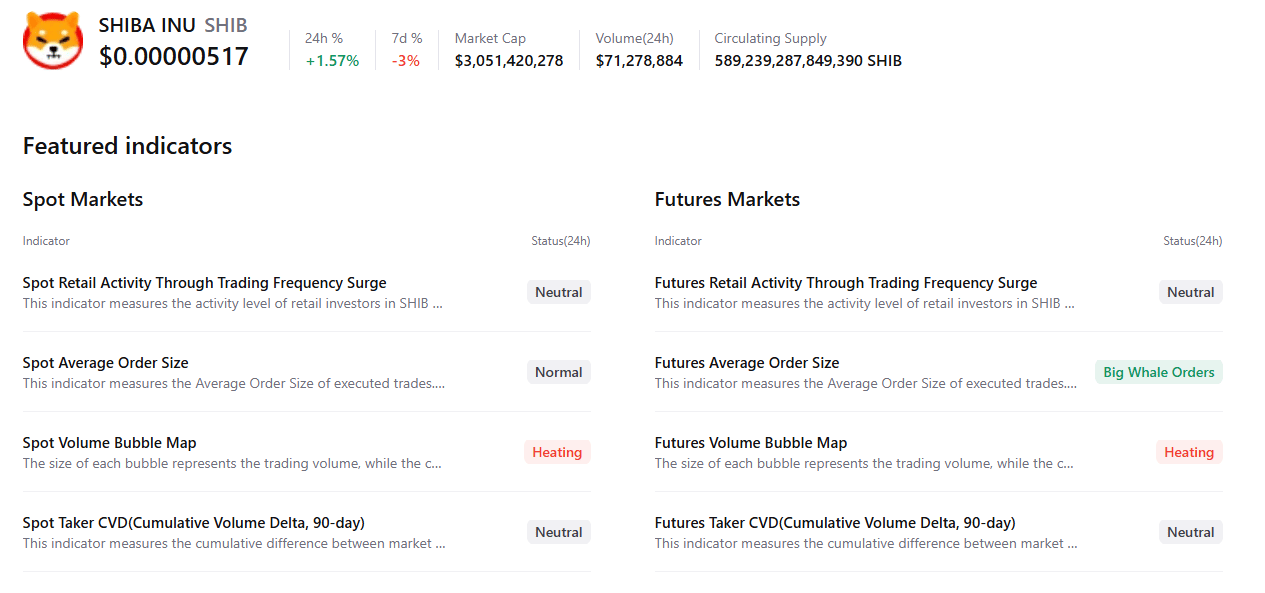
SHIB summary chart. Source: CryptoQuant

Shiba Inu technical outlook: Key support holds strong

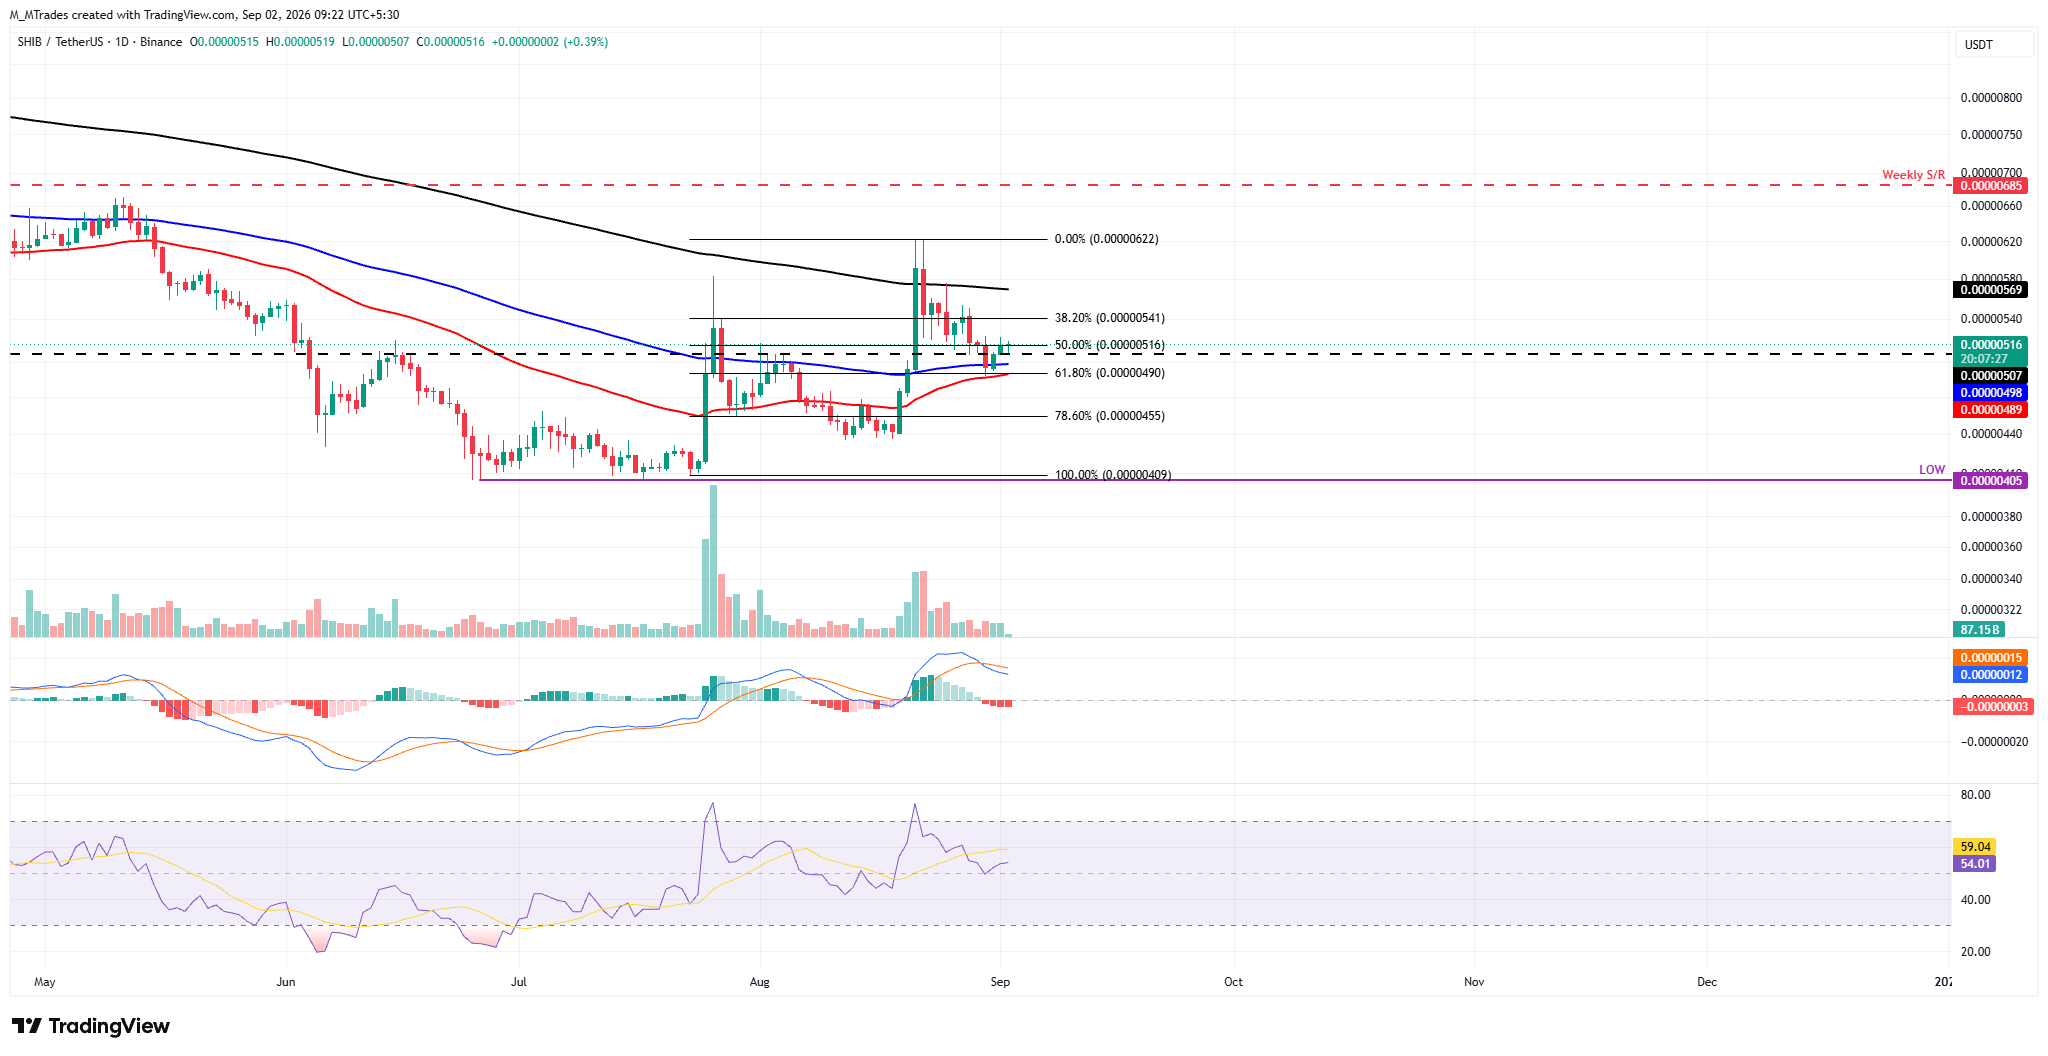
Shiba Inu price trades around $0.00000516 on Wednesday after rebounding nearly 4% earlier this week, following a retest of the key 50-day EMA around $0.00000489.

If SHIB continues its recovery, it could extend the rally toward the 200-day EMA at $0.00000569.

Momentum indicators show mixed sentiment: The daily Relative Strength Index (RSI) reads 54 and is rising, indicating strengthening bullish momentum. However, the Moving Average Convergence Divergence (MACD) showed a bearish crossover on Sunday with rising red histogram bars, indicating bearish bias.
SHIB/USDT daily chart

If SHIB faces a correction, it could extend the decline toward the 50-day EMA at $0.00000489.

Disclaimer: For information purposes only. Past performance is not indicative of future results.
placeholder
Pi Network Price Annual Forecast: PI Heads Into a Volatile 2026 as Utility Questions Collide With Big UnlocksPi Network heads into 2026 after a 90%+ 2025 drawdown from $3.00, with 17.5 million KYC users and a smart-contract-focused Stellar v23 upgrade offering upside potential, but 1.21 billion tokens unlocking and heavy exchange deposits (437 million PI) keeping supply pressure and trust risks firmly in focus.
Author  Mitrade
Dec 19, 2025
Pi Network heads into 2026 after a 90%+ 2025 drawdown from $3.00, with 17.5 million KYC users and a smart-contract-focused Stellar v23 upgrade offering upside potential, but 1.21 billion tokens unlocking and heavy exchange deposits (437 million PI) keeping supply pressure and trust risks firmly in focus.
placeholder
Markets in 2026: Will gold, Bitcoin, and the U.S. dollar make history again? — These are how leading institutions thinkAfter a turbulent 2025, what lies ahead for commodities, forex, and cryptocurrency markets in 2026?
Author  Insights
Dec 25, 2025
After a turbulent 2025, what lies ahead for commodities, forex, and cryptocurrency markets in 2026?
placeholder
ECB Policy Outlook for 2026: What It Could Mean for the Euro’s Next MoveWith the ECB likely holding rates steady at 2.15% and the Fed potentially extending cuts into 2026, EUR/USD may test 1.20 if Eurozone growth proves resilient, but weaker growth and an ECB pivot could pull the pair back toward 1.13 and potentially 1.10.
Author  Mitrade
Dec 26, 2025
With the ECB likely holding rates steady at 2.15% and the Fed potentially extending cuts into 2026, EUR/USD may test 1.20 if Eurozone growth proves resilient, but weaker growth and an ECB pivot could pull the pair back toward 1.13 and potentially 1.10.
placeholder
Gold Price Forecast: Can Gold Keep Rising as Fed Rate Hike Expectations Heat Up and US-Iran Conflict Escalates? As of the Asian session on August 31, gold prices today (XAUUSD) extended last Friday's decline, briefly falling below $4,400 during intraday trading to hit a low of $4,396.36. Last Frida
Author  TradingKey
Aug 31, Mon
As of the Asian session on August 31, gold prices today (XAUUSD) extended last Friday's decline, briefly falling below $4,400 during intraday trading to hit a low of $4,396.36. Last Frida
placeholder
US Dollar Index Price Forecast: DXY eyes 99.75 confluence hurdle amid Fed bets, Iran risksThe US Dollar Index (DXY), which tracks the Greenback against a basket of currencies, regains positive traction on Tuesday and climbs back above the mid-99.00s during the first half of the European session.
Author  FXStreet
20 hours ago
The US Dollar Index (DXY), which tracks the Greenback against a basket of currencies, regains positive traction on Tuesday and climbs back above the mid-99.00s during the first half of the European session.
goTop
quote