


Ripple Price Forecast: XRP risks extending decline as fragile technical structure persists
- XRP faces intensifying headwinds, trading at $1.37 on Tuesday, while the 200-day EMA provides immediate support.
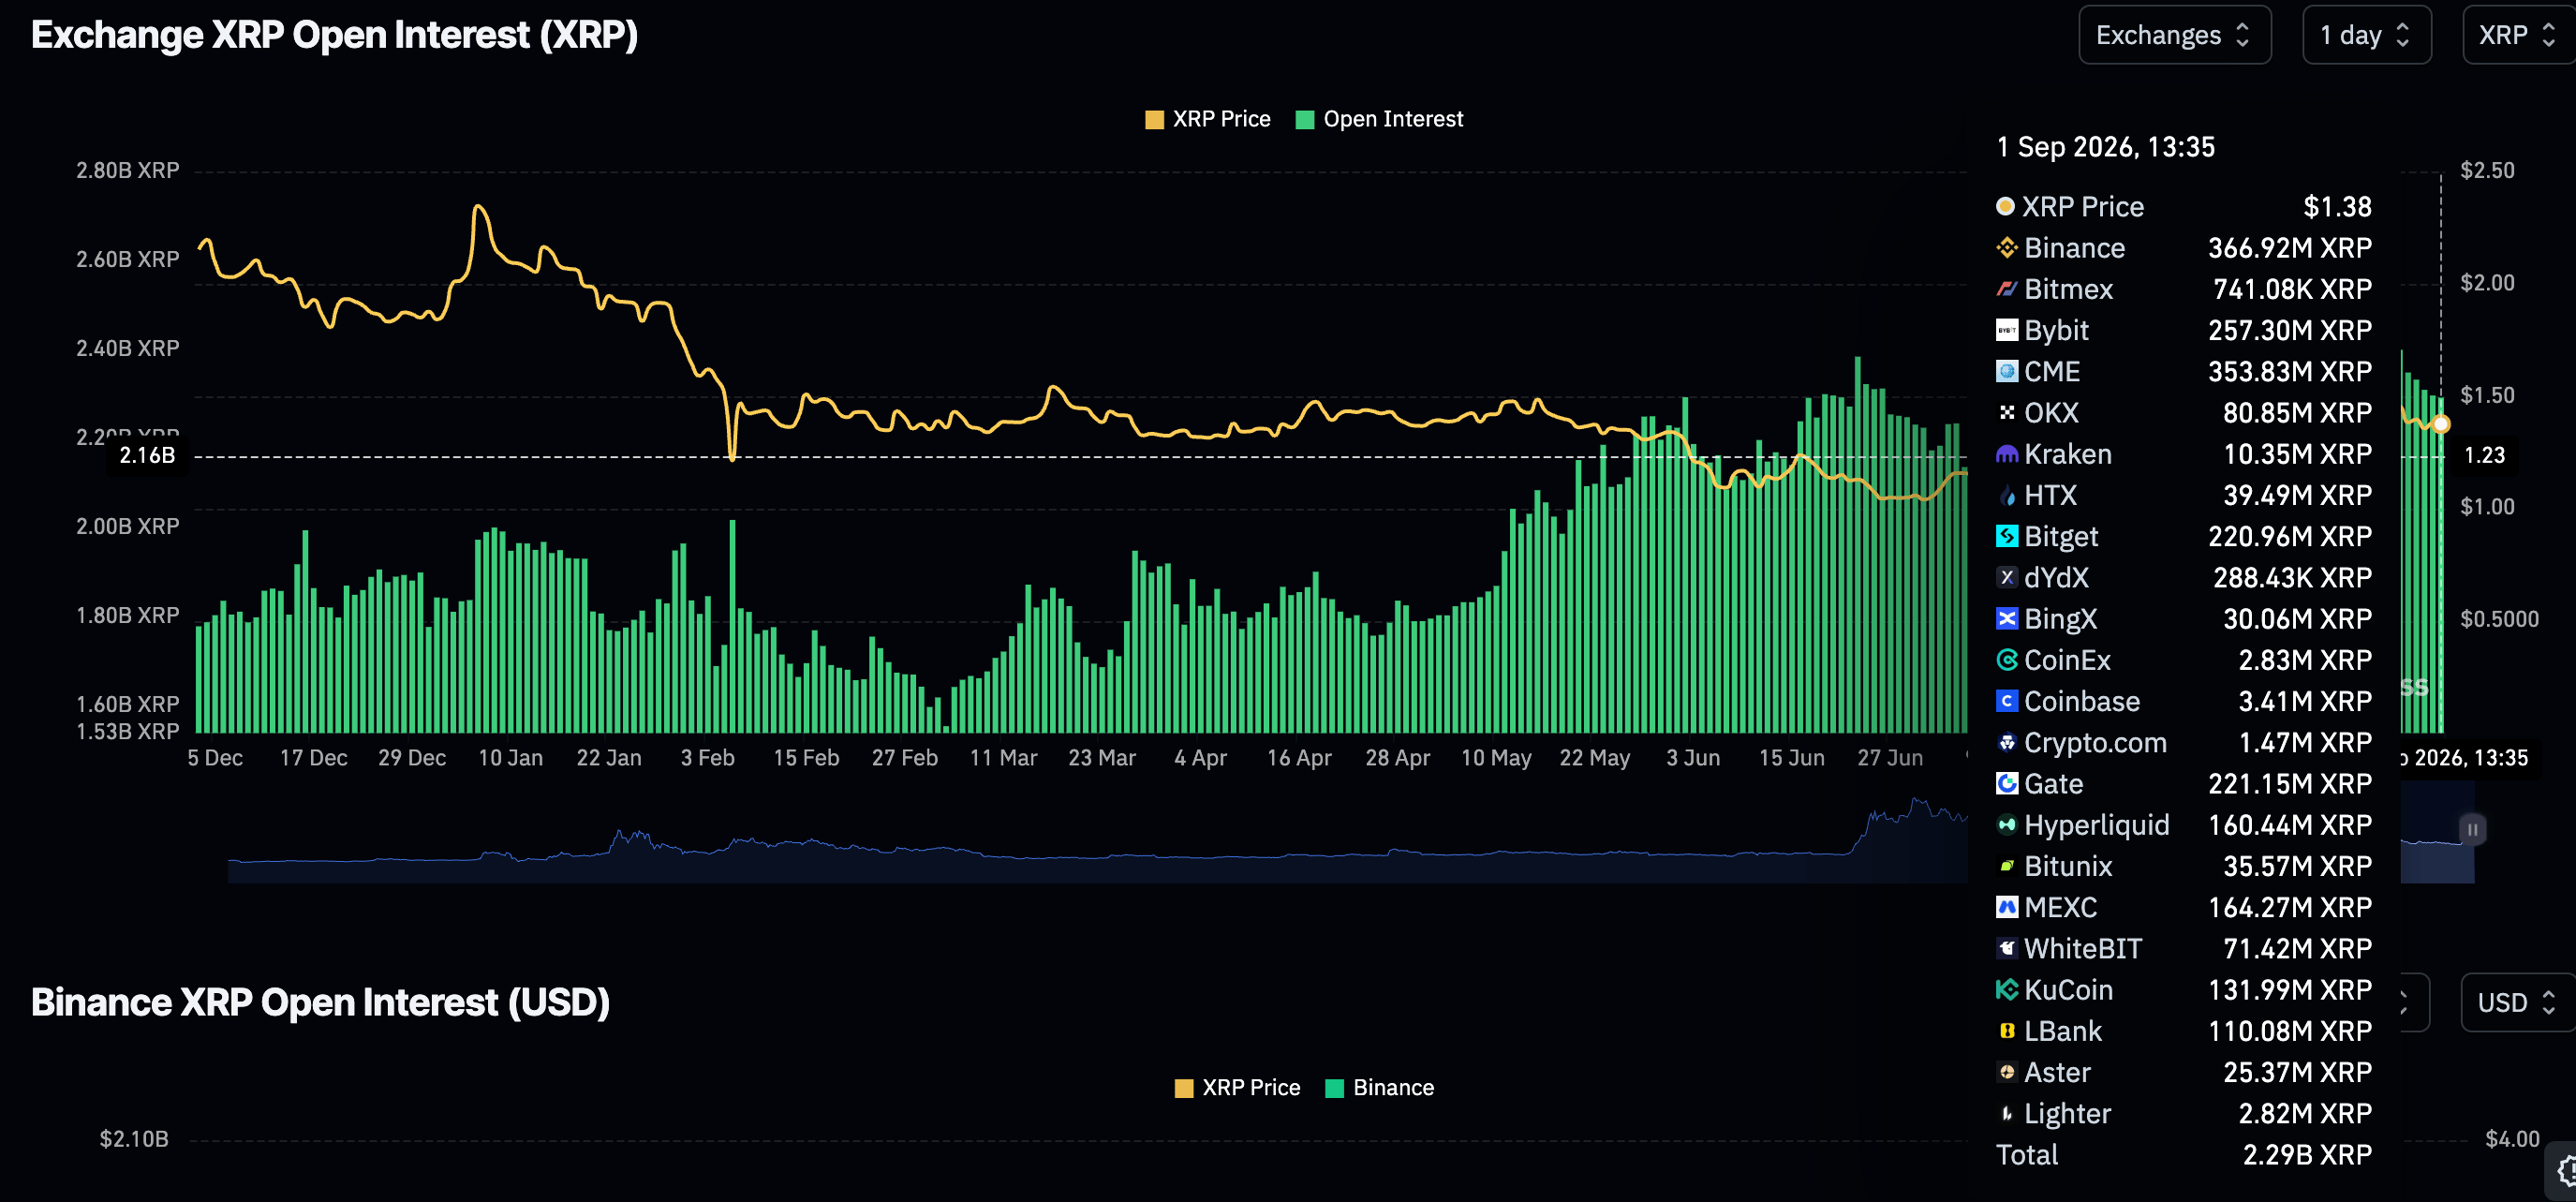
- XRP derivatives come under pressure as perpetual futures Open Interest narrows to 2.29 billion XRP.
- XRP remains vulnerable to further downside, as weakening momentum signals continue to exert pressure.
Ripple (XRP) retains a neutral-to-bullish outlook, trading at $1.37 on Tuesday. The remittance token upside has remained broadly constrained since the rally to $1.70 on August 17. The $1.35 level, anchored by a key moving average, continues to act as critical support, offering a potential foothold for XRP as the market eyes a possible rebound.
XRP attracts steady ETF inflows on sustained appetite
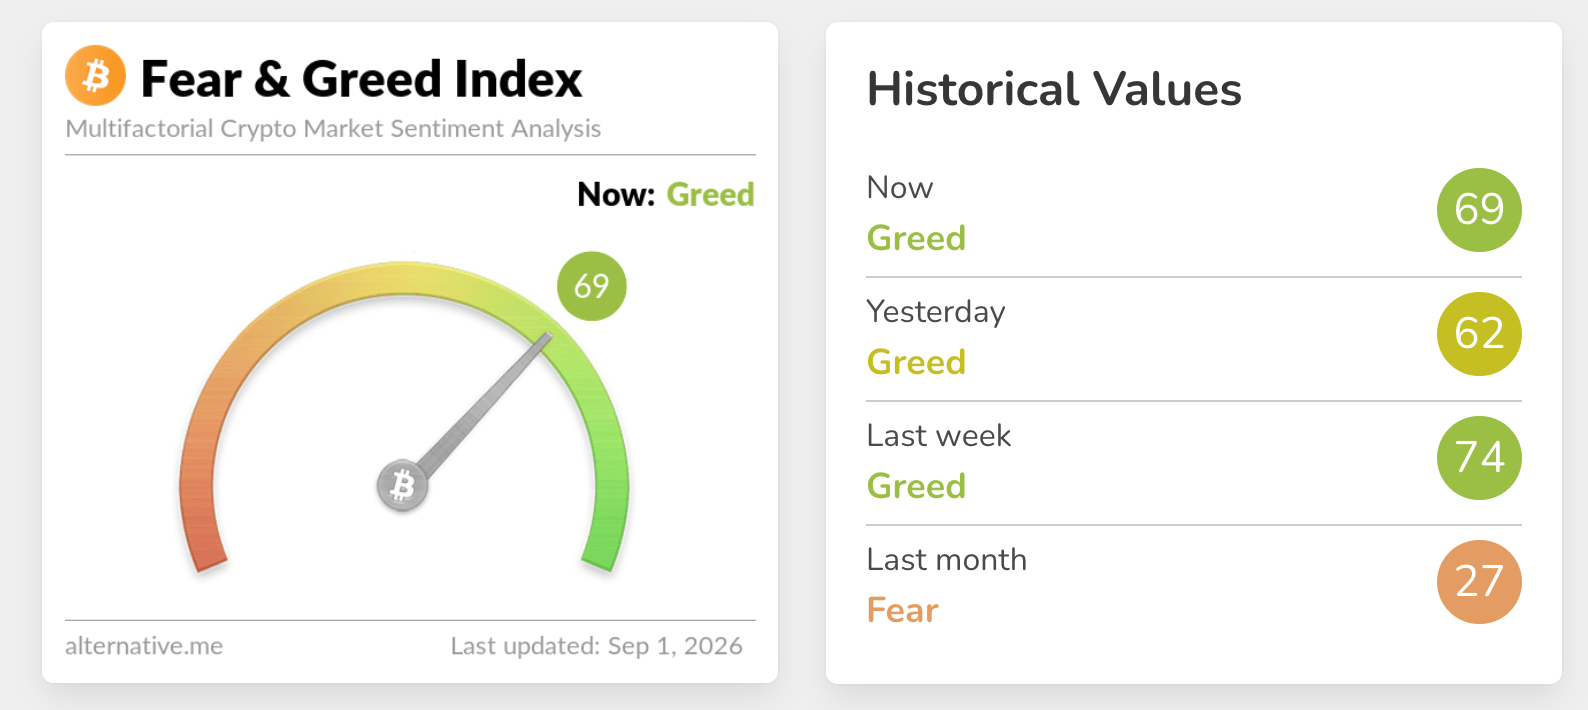
Risk appetite remains relatively elevated, underpinned by sustained bullish sentiment across broader markets. The Fear & Greed Index printed 69 on Tuesday in the Greed territory, up from 62 the previous day, reflecting a modest uptick in investor confidence.
If sustained, higher demand for XRP-related digital asset investment products could cushion headwinds and raise the odds of a renewed recovery.
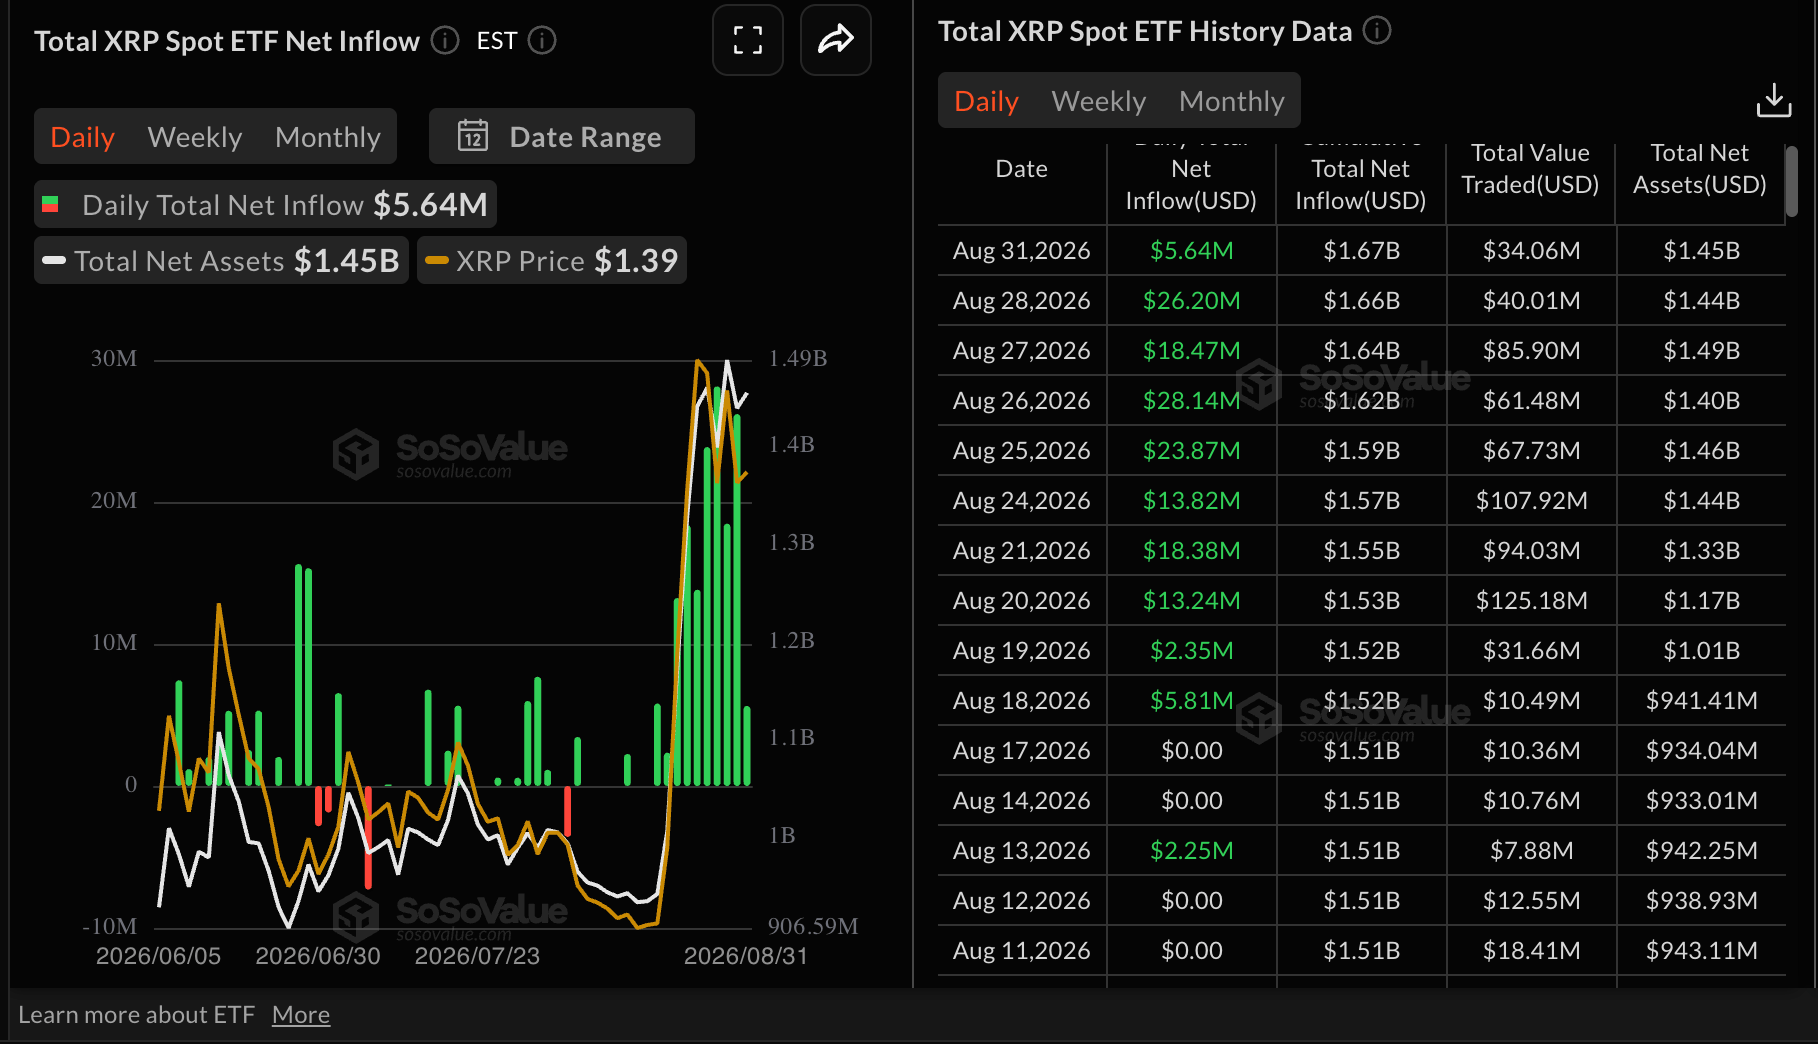
XRP spot Exchange-Traded Funds (ETFs) logged a tenth straight day of inflows, adding nearly $6 million on Monday. Despite a drop from $26 million posted last Friday, cumulative inflows have reached $1.66 billion. Meanwhile, average net assets under management are steady at $1.45 billion.
Conversely, derivatives are in a persistent decline, as perpetual futures Open Interest (OI) fell to 2.29 billion XRP on Tuesday, up from 2.2 billion XRP the day before. More broadly, OI peaked at 2.78 billion in August, undermining demand and risk appetite. A deeper sell-off could add to headwinds in the spot market, as the odds of an extended decline rise.
Technical analysis: XRP struggles to uphold bullish outlook
XRP trades above $1.37, maintaining a bullish near-term bias as price holds above the main Exponential Moving Averages (EMAs), which underpin a broader constructive structure. However, momentum is mixed, with the Relative Strength Index (RSI) hovering around 62 and suggesting sustained but reduced buying interest. The Moving Average Convergence Divergence (MACD) has slipped marginally below the signal line and zero, hinting at some loss of upside conviction rather than a full-fledged reversal.
-1788259849152.png)
Immediate support is seen at the $1.35 area, where the 200-day EMA aligns as the first line of defense ahead of the $1.21 region, reinforced by the clustered 50-day and 100-day EMAs. As long as XRP holds above these supports, pullbacks are likely to be treated as corrective within the broader advance, with buyers expected to re-emerge on dips while the next meaningful resistance is left to be defined by future highs beyond the current $1.37 zone.
(The technical analysis of this story was written with the help of an AI tool. Know more.)
Open Interest, funding rate FAQs
Higher Open Interest is associated with higher liquidity and new capital inflow to the market. This is considered the equivalent of increase in efficiency and the ongoing trend continues. When Open Interest decreases, it is considered a sign of liquidation in the market, investors are leaving and the overall demand for an asset is on a decline, fueling a bearish sentiment among investors.
Funding fees bridge the difference between spot prices and prices of futures contracts of an asset by increasing liquidation risks faced by traders. A consistently high and positive funding rate implies there is a bullish sentiment among market participants and there is an expectation of a price hike. A consistently negative funding rate for an asset implies a bearish sentiment, indicating that traders expect the cryptocurrency’s price to fall and a bearish trend reversal is likely to occur.
Recommended Articles


