


The Stock Market Is Historically Expensive Right Now. Here's Why I'm Still Investing.
Key Points
The widely watched CAPE ratio suggests that the S&P 500 index is at its highest valuation since 2000.
Even if the S&P 500 is overpriced, long-term investors should feel confident about buying shares.
Diversifying with mid caps, small caps, and international stocks can also reduce worries about the high valuations of the S&P 500.
- 10 stocks we like better than S&P 500 Index ›
On one hand, all-time highs in the S&P 500 (SNPINDEX: ^GSPC) are good news for investors. Stocks are up, the artificial intelligence (AI) boom is sparking excitement, and millions of American households are building wealth. Everyone should be happy, right?
Wrong. Many investors are feeling nervous right now about the stock market because it's been on such a strong run. They're worried that the bull market can't last much longer and that what goes up must come down. By some widely watched metrics -- like the Shiller cyclically adjusted price-to-earnings (P/E) ratio, or CAPE ratio -- the stock market is looking historically expensive. Future corporate earnings might not be high enough to justify today's high share prices.
Missed Nvidia in 2009? This Rare Signal Is Flashing Again. In 2009, a "Double Down" signal flashed for a little-known chipmaker called Nvidia. For the first time in years, that same "Total Conviction" signal is flashing for a company 1/100th the size of Nvidia. Continue »
As an ominous sign, the S&P 500 index's CAPE ratio hasn't been this high since 2000. That was right before the dot-com bubble burst.
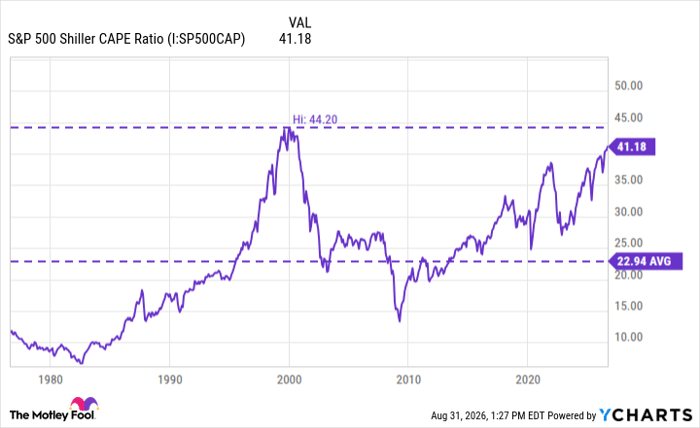
S&P 500 Shiller CAPE Ratio data by YCharts
Does this mean that the stock market is doomed and we're about to have a stock market crash? No one knows what's going to happen next with stock market prices. Stock market history doesn't always repeat itself. And even if there is a stock market downturn on the horizon, I'm going to keep buying stocks for the long term.
Let's look at a few reasons why.

Image source: Getty Images.
1. For a long-term investor, there's never a "bad time" to buy stocks
Many people worry that the moment after they buy stocks, the market will crash.
Here's the thing: It's understandable to feel nervous about buying stocks. Stocks can be risky. Stock market downturns, corrections, and crashes happen.
But instead of worrying about what might happen in the stock market tomorrow, think about what is likely to happen over the next five to 10 years. Is the stock market the best place for your money to go to work for the long term? Most of the time, the answer is yes, and the broader stock market delivers strong gains for long-term investors.
The S&P 500 has delivered an average annual return of 10% over the past 98 years, since 1928. And that includes some of the worst economic crises and crashes in American history, like the Great Depression.
Most long-term investors should try to ignore the short-term anxiety and just buy a low-cost exchange-traded fund (ETF) that tracks the S&P 500. The Vanguard S&P 500 ETF (NYSEMKT: VOO) is one of the best. In the past 10 years, it's delivered 15% annualized returns.
2. I'm well-diversified with U.S. stocks and international stocks
Some investors worry that the S&P 500 has become too top-heavy with highly valued AI stocks that could be vulnerable in a tech sell-off. You don't have to buy only the 500 largest publicly traded U.S. stocks. You can get even more diversified by owning mid caps, small caps, and international stocks.
I own the Vanguard Morningstar Total Stock Market ETF (NYSEMKT: VTI) because it includes more than 3,500 U.S. stocks, not just the biggest companies. I also own international stocks, because I want to invest in future growth opportunities around the world, not just in America.
A good way to do that is to buy a broadly diversified international ETF, such as the iShares Core MSCI Total International Stock ETF (NASDAQ: IXUS). This fund holds 4,494 stocks from companies around the world. It's delivered annualized returns of 9.42% for the past 10 years and an impressive one-year return of 27.55%.
3. I keep buying stocks every month with dollar-cost averaging
Are you going to put your entire life savings into the stock market all in one day and then never invest again? If so, it's understandable to feel nervous about high valuations and bad timing.
But most people don't invest like that. Most people buy a few hundred dollars or a few thousand dollars' worth of stocks every month, every payday, year after year. This is called dollar-cost averaging.
Even if the stock market goes down tomorrow, even if it drops 5% or 10% in the next few months, if you keep investing the same $100 automatically out of every paycheck, you keep buying larger numbers of shares at lower prices. After a 5% to 10% stock market sell-off, your same $100 investment buys 5% to 10% more stock than it did before. It sounds counterintuitive, but it's true: Stock market downturns can actually be "good news" for long-term investors.
The goal is to keep buying more shares of the stock market over time. As a long-term investor, you are likely to benefit from future growth in corporate earnings, dividends paid to shareholders, and share price accumulation.
I don't know what will happen to the stock market or the economy tomorrow, next month, or next year. Maybe people are right to worry about the CAPE ratio, and the S&P 500 is way overpriced and due for a correction. But I believe in the next 10 years (and beyond), my investments in a diversified portfolio of low-cost index funds will pay off. That's why I keep buying stocks every month, every payday.
Should you buy stock in S&P 500 Index right now?
Before you buy stock in S&P 500 Index, consider this:
The Motley Fool Stock Advisor analyst team just identified what they believe are the 10 best stocks for investors to buy now… and S&P 500 Index wasn’t one of them. The 10 stocks that made the cut could produce monster returns in the coming years.
Consider when Netflix made this list on December 17, 2004... if you invested $1,000 at the time of our recommendation, you’d have $437,097!* Or when Nvidia made this list on April 15, 2005... if you invested $1,000 at the time of our recommendation, you’d have $1,355,077!*
Now, it’s worth noting Stock Advisor’s total average return is 978% — a market-crushing outperformance compared to 213% for the S&P 500. Don't miss the latest top 10 list, available with Stock Advisor, and join an investing community built by individual investors for individual investors.
See the 10 stocks »
*Stock Advisor returns as of September 2, 2026.
Ben Gran has positions in Vanguard Morningstar Total Stock Market ETF. The Motley Fool has positions in and recommends Vanguard S&P 500 ETF. The Motley Fool has a disclosure policy.
Recommended Articles


