Pi Network Price Forecast: PI holds at key support as broader market declines

Source Fxstreet
  • Pi Network holds steady around $0.08745 on Tuesday after two consecutive days of losses.
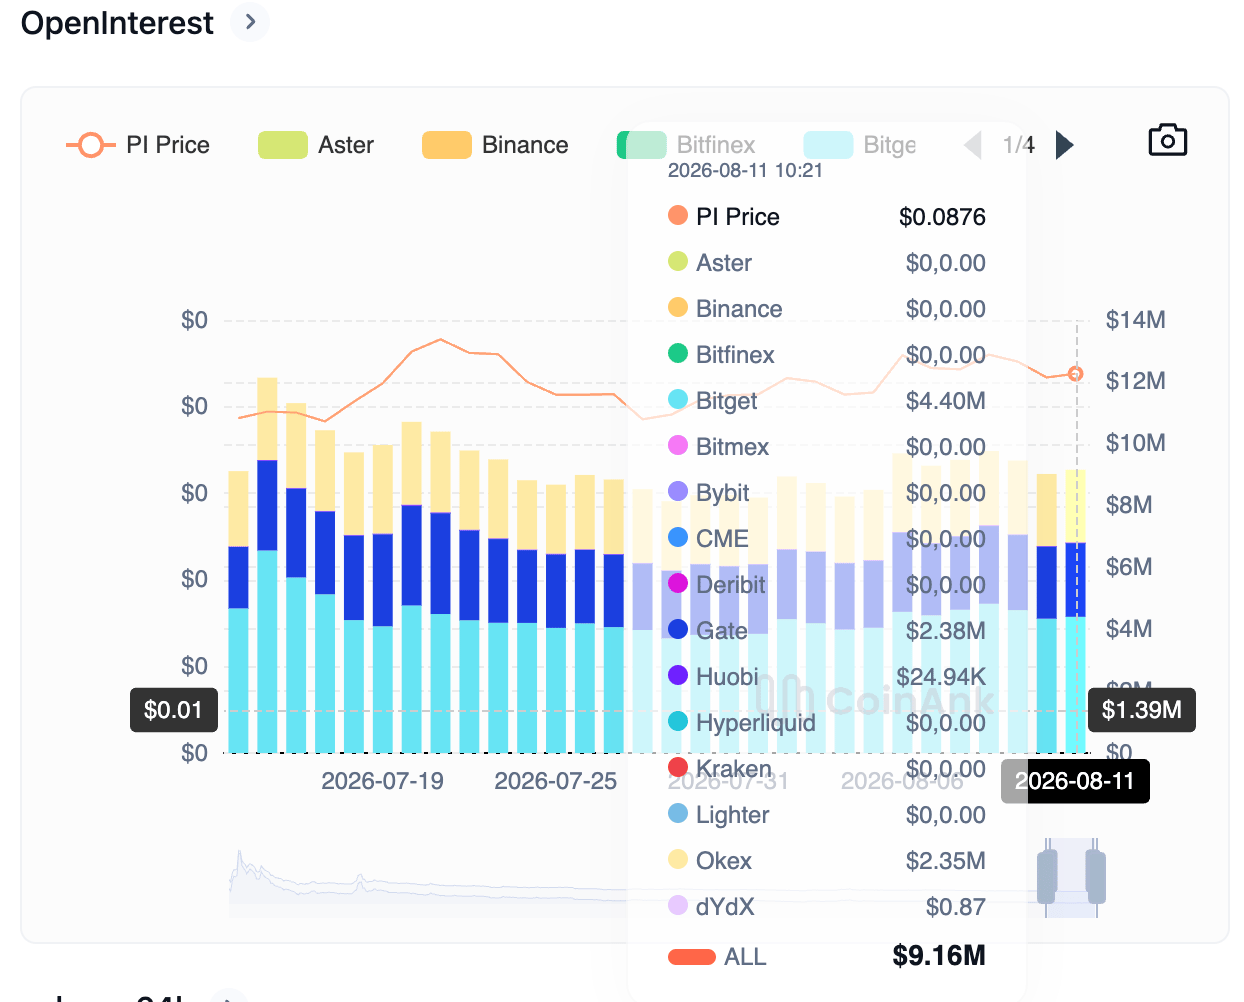
  • PI futures Open Interest remains at $9.16 million as the broader crypto market sentiment deteriorates.
  • The technical outlook for PI suggests a mild downside bias as momentum remains neutral to bearish.

Pi Network (PI) steadies around $0.08745 on Tuesday after two consecutive days of losses, capped below the $0.1000 psychological threshold. Retail demand in PI derivatives remains firm, with Open Interest above $9 million, even as broader crypto market sentiment wanes. Technically, PI faces a steeper correction, as it lacks upside momentum to support a near-term recovery. 

Demand in PI futures holds firm amid declining market sentiment

The broader crypto market is subject to recurring bearish catalysts, maintaining a downside bias. The recent pullback in Bitcoin (BTC) price, with MARA holdings and Strategy reducing their exposure, as previously reported by FXStreet, weighs on altcoins. 

Despite broader market pressure, CoinAnk data shows PI futures Open Interest at $9.16 million, up from $9.02 million the previous day, indicating a mild buildup in positions. 
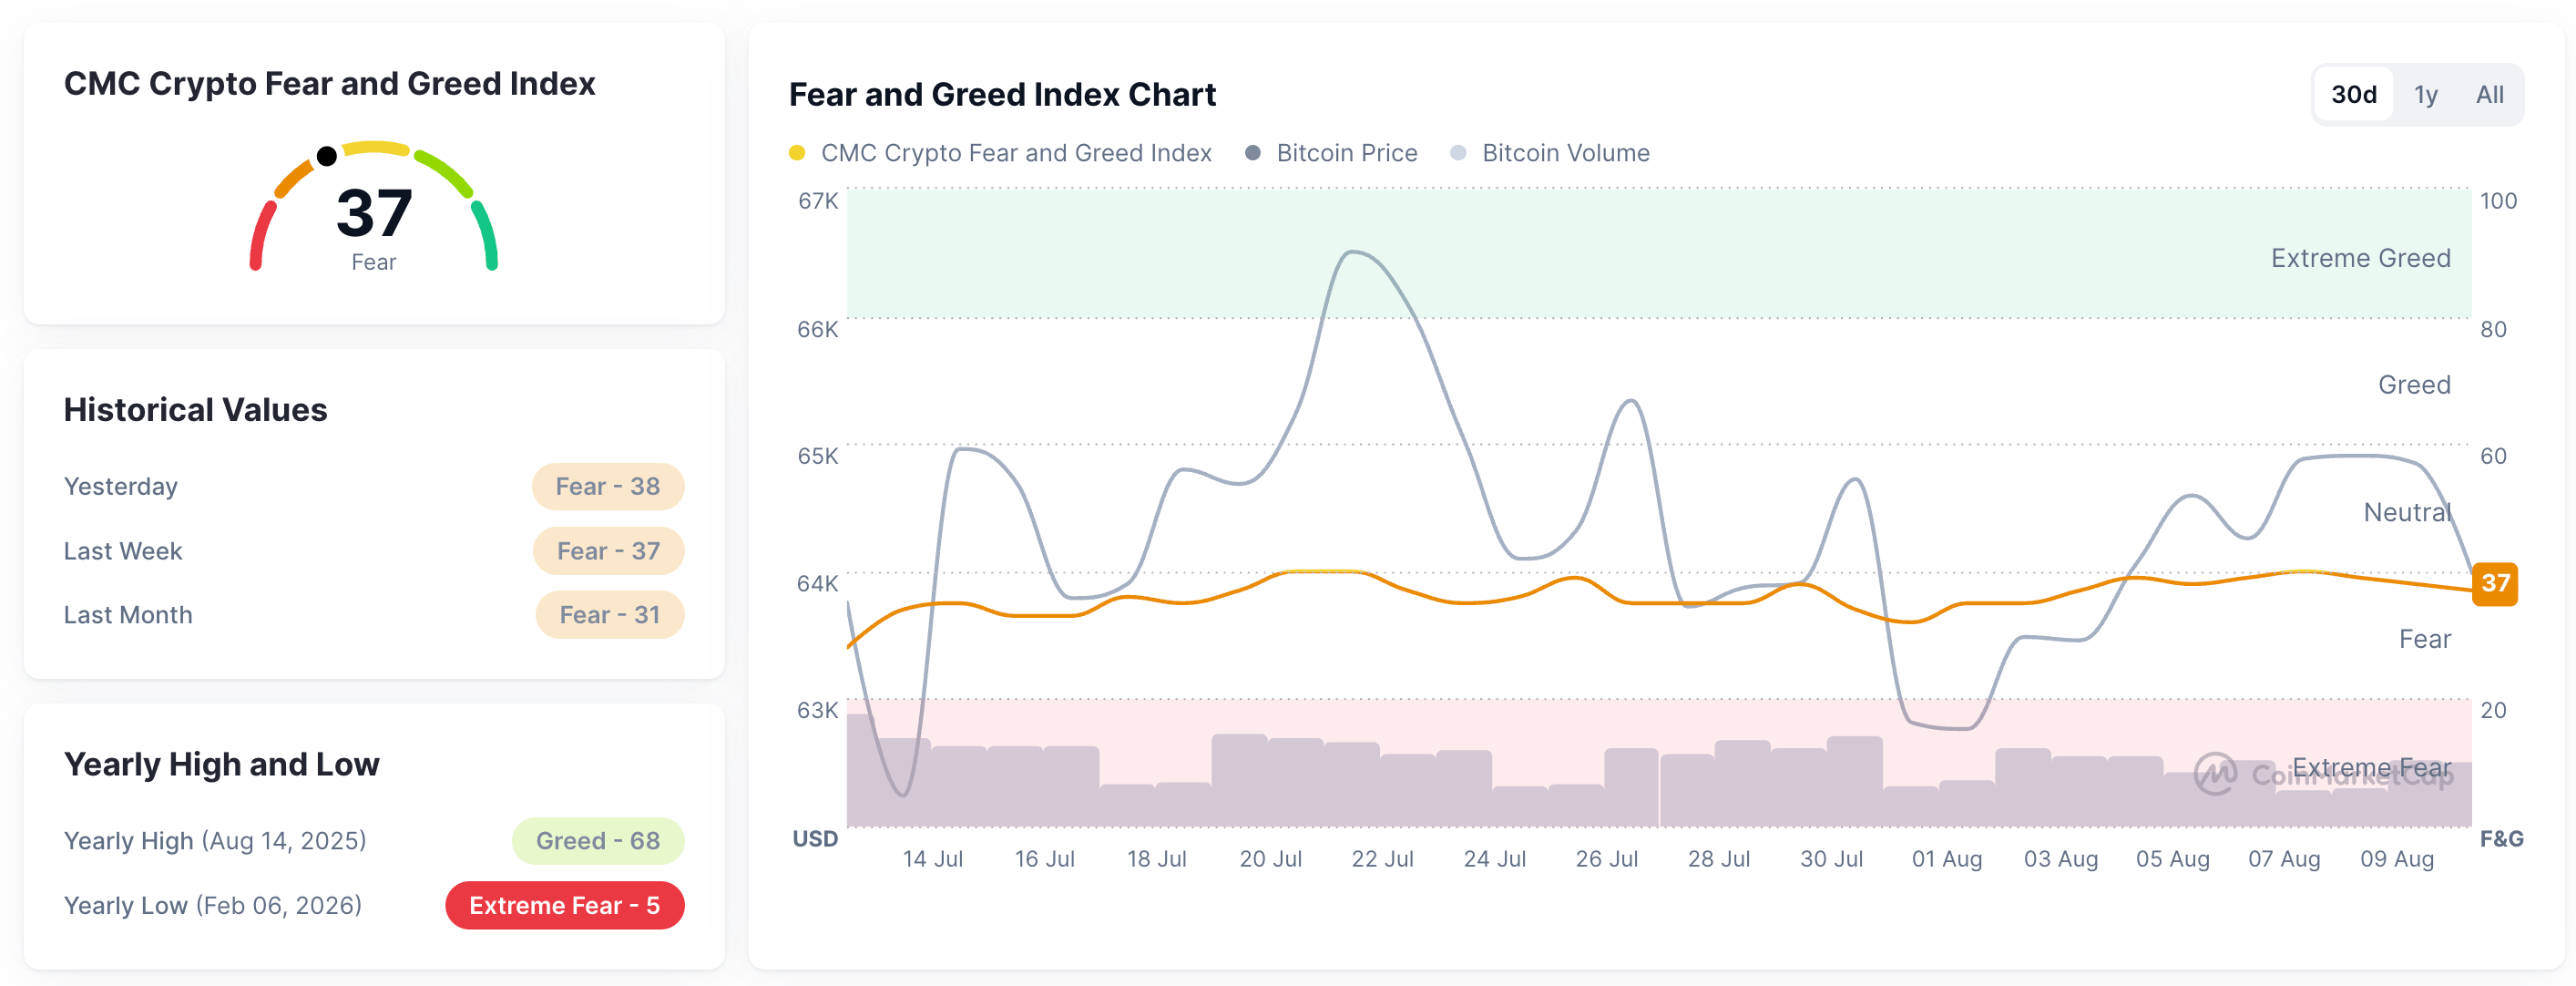
Fear and Greed Index. Source: CoinMarketCap
PI token Open Interest chart. Source: CoinAnk

Technical outlook: Will PI perform a post-retest rebound to $0.10?

Pi Network extends its decline well below the $0.1000 threshold, which serves as the primary overhead barrier and keeps the broader tone bearish. At the time of writing, PI tests the broken downward trendline near the 78.6% Fibonacci retracement level (measured from $0.13410 to $0.07032) at $0.08397.

Momentum is mixed on the daily chart, as the Relative Strength Index (RSI) at 26 sits in oversold territory, hinting at stretched downside conditions, while the Moving Average Convergence Divergence (MACD) indicator holds marginally above its signal line, suggesting that selling pressure may be losing intensity.

Looking up, a rebound from the $0.08397 support zone could test the 50% retracement at $0.10221, followed by the 23.6% Fibonacci retracement level at $0.11905.
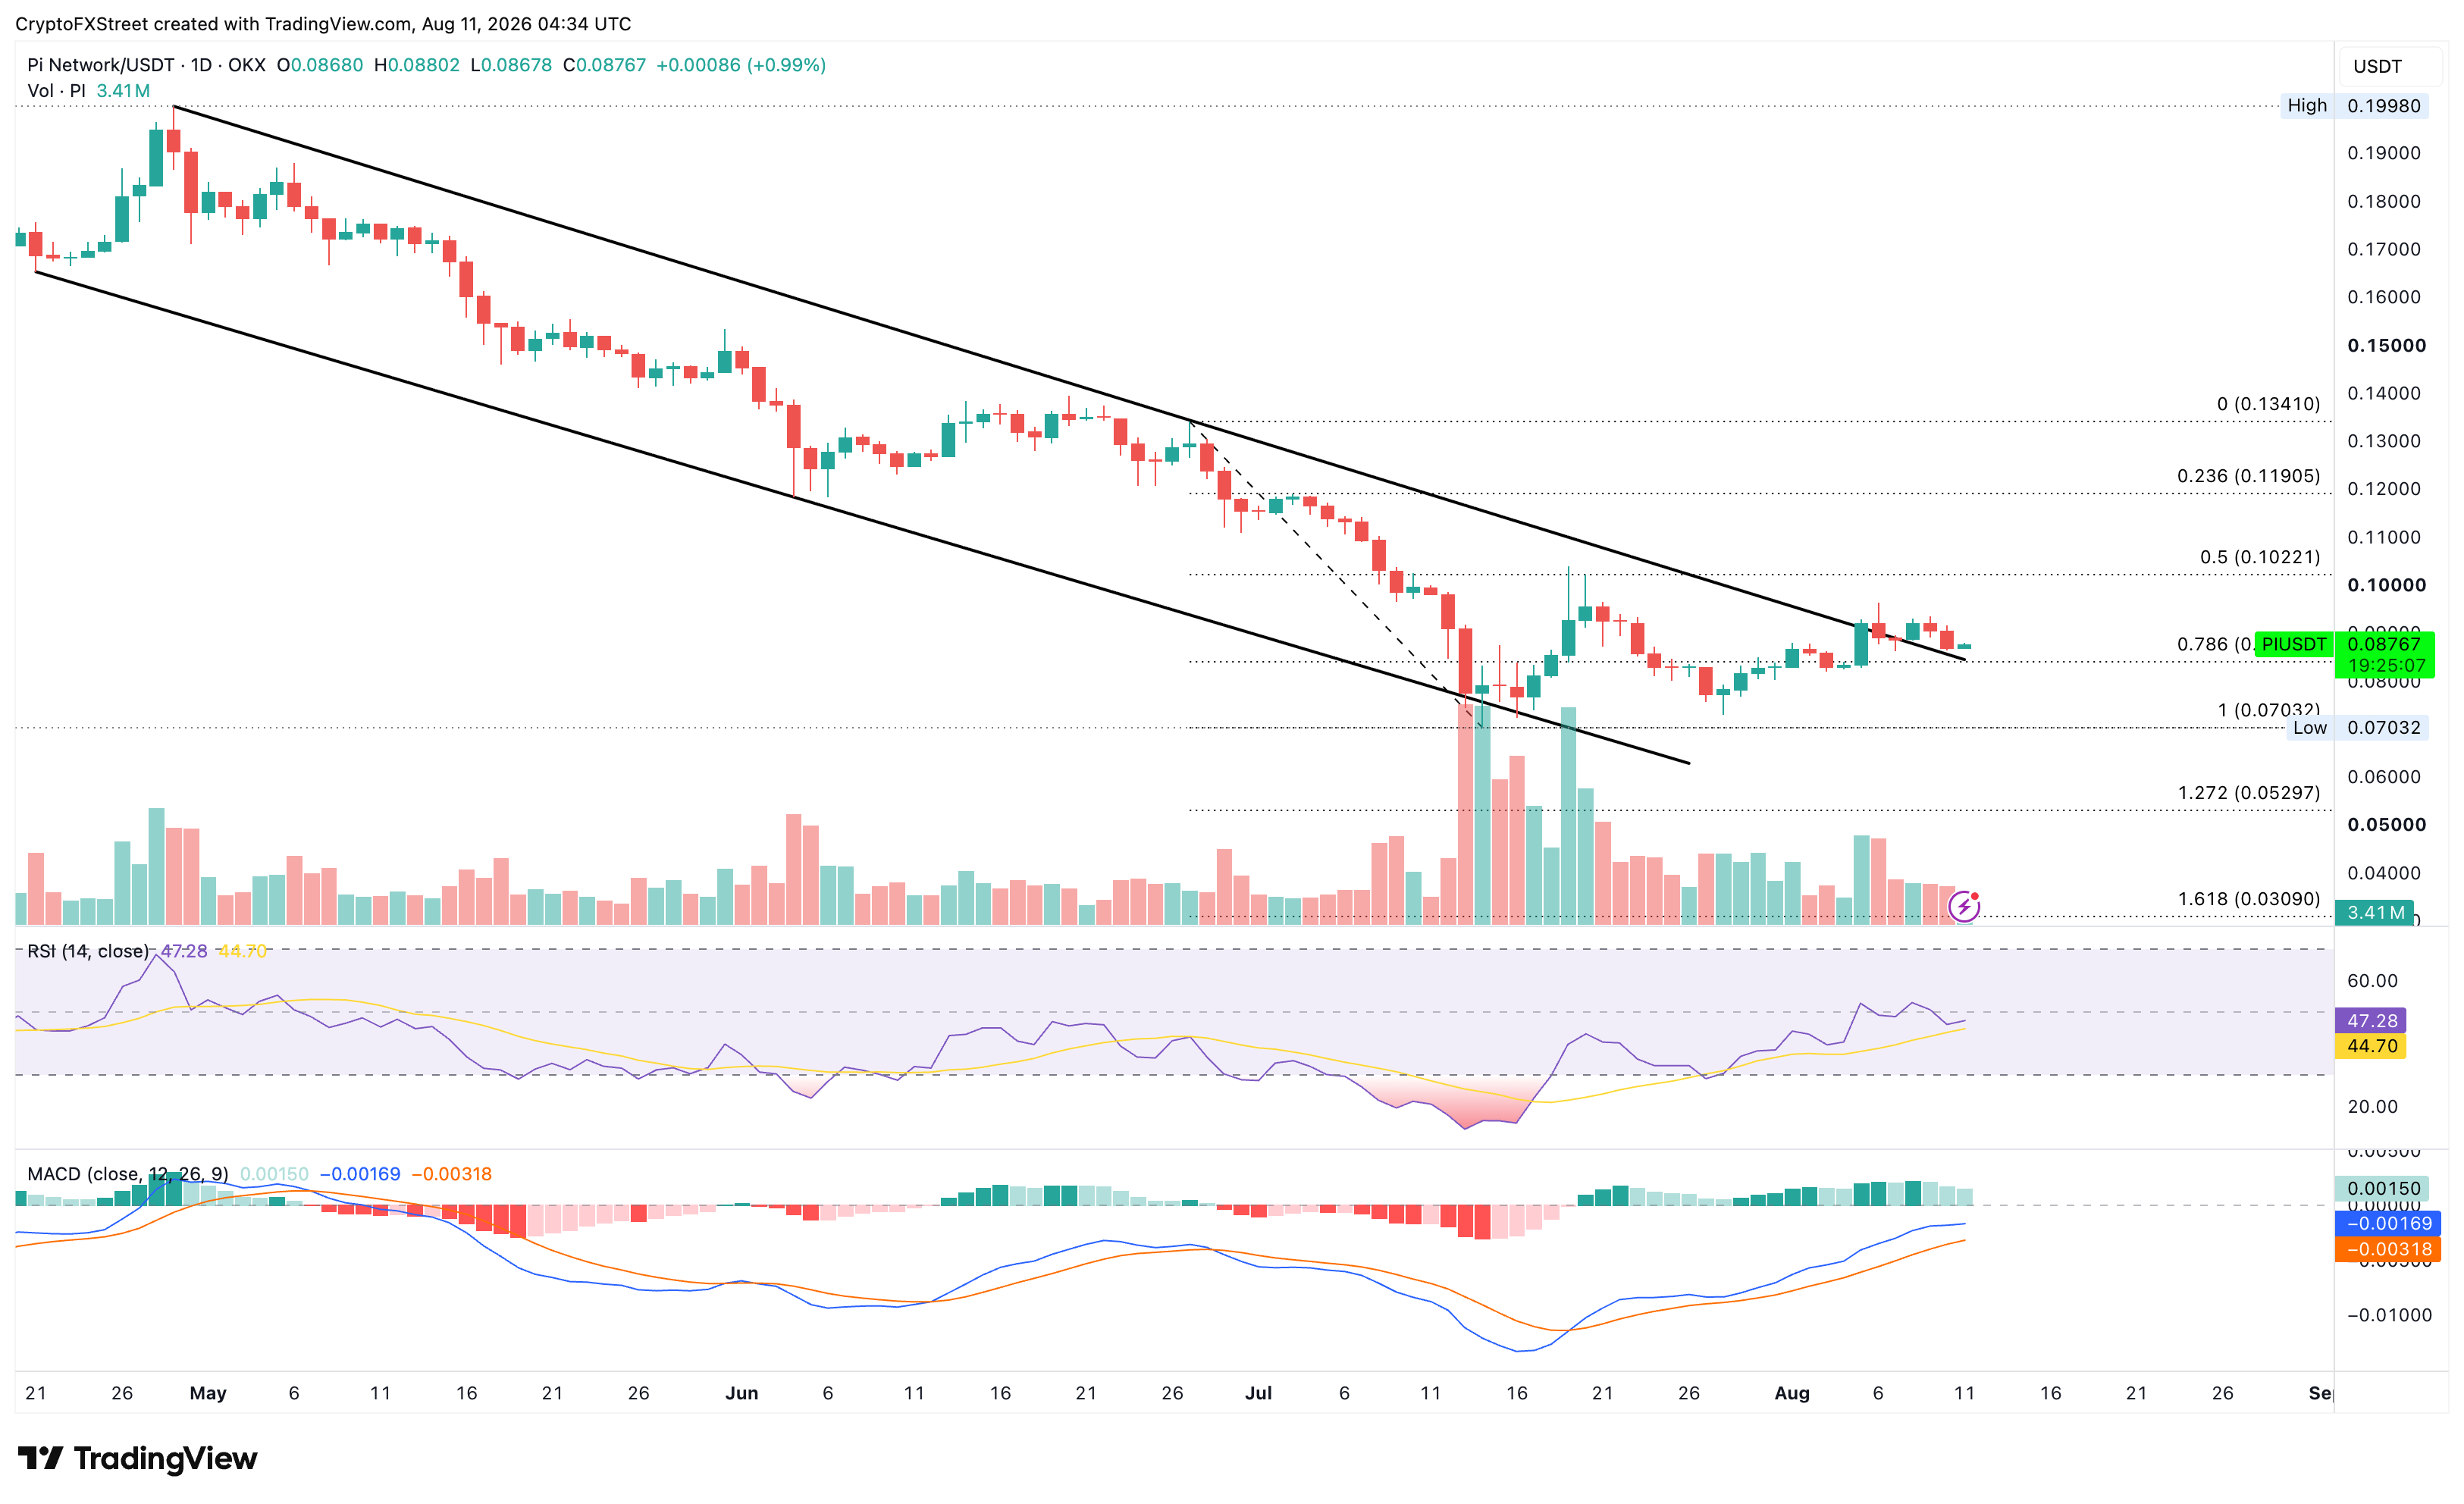
PI/USDT daily price chart.

On the downside, a slip below $0.08397 could nullify rebound chances, extending a potential decline toward the $0.07000 round figure.

(The technical analysis of this story was written with the help of an AI tool. Know more.)

Disclaimer: For information purposes only. Past performance is not indicative of future results.
placeholder
Markets in 2026: Will gold, Bitcoin, and the U.S. dollar make history again? — These are how leading institutions thinkAfter a turbulent 2025, what lies ahead for commodities, forex, and cryptocurrency markets in 2026?
Author  Insights
Dec 25, 2025
After a turbulent 2025, what lies ahead for commodities, forex, and cryptocurrency markets in 2026?
placeholder
Finding The Best Japan Stocks to Buy? These are Top Japanese Companies to Watch Discover the best Japanese stocks to buy, including AI semiconductor leaders, Buffett-backed trading houses, and undervalued Japan stocks benefiting from corporate reforms and yen trends.
Author  Mitrade
May 29, Fri
Discover the best Japanese stocks to buy, including AI semiconductor leaders, Buffett-backed trading houses, and undervalued Japan stocks benefiting from corporate reforms and yen trends.
placeholder
Gold rallies to two-week high as USD softens on Iran deal hopes, receding Fed hike betsGold (XAU/USD) attracts buyers for the second consecutive day and surges past the $4,100 mark to hit a nearly two-week high during the Asian session on Wednesday.
Author  FXStreet
Aug 05, Wed
Gold (XAU/USD) attracts buyers for the second consecutive day and surges past the $4,100 mark to hit a nearly two-week high during the Asian session on Wednesday.
placeholder
Bitcoin Price Forecast: Persistent ETF inflows, easing Middle East tensions lift risk appetiteBitcoin (BTC) extends its gains, trading above $64,800 at the time of writing on Thursday, breaking above the key resistance zone. Institutional demand supports BTC price action with spot Exchange Traded Funds (ETFs) recording a third consecutive day of inflows so far this week.
Author  FXStreet
Aug 06, Thu
Bitcoin (BTC) extends its gains, trading above $64,800 at the time of writing on Thursday, breaking above the key resistance zone. Institutional demand supports BTC price action with spot Exchange Traded Funds (ETFs) recording a third consecutive day of inflows so far this week.
placeholder
Gold Price Forecast: Can Gold Still Rise Above $4,300 Ahead of July Non-Farm Payrolls?As of the European session on August 7, gold prices ( XAUUSD) extended their recent strong performance, rising over 1% intraday to briefly cross the $4,300 mark. With a cumulative gain of
Author  TradingKey
Aug 07, Fri
As of the European session on August 7, gold prices ( XAUUSD) extended their recent strong performance, rising over 1% intraday to briefly cross the $4,300 mark. With a cumulative gain of
goTop
quote