


Bitcoin Price Prediction: Can BTC Reverse Downtrend as ETF Flows Fluctuate?
TradingKey - As of July 30, Eastern Time, Bitcoin ( BTC) was trading near $64,500, extending its rebound from the prior two trading days. Recently, Bitcoin rebounded from an interim low of $57,800 in early July and briefly approached $67,000, but its upward momentum subsequently weakened, and it is currently fluctuating within the $63,000 to $65,000 range. Overall, short-term sentiment for Bitcoin has recovered significantly compared to the end of June. However, fluctuating ETF flows, the Federal Reserve's hawkish stance, and cooling corporate purchasing demand mean this rally remains temporarily closer to an oversold rebound than a new bull market trend.
Fed Stands Pat as ETF Inflows Return but Lack Sustainability
The primary factor influencing Bitcoin's recent trajectory remains Federal Reserve policy. At its July meeting, the Fed maintained the federal funds rate at 3.50% to 3.75%, but the decision was approved by a mere 9-3 vote, with three officials advocating for a 25-basis-point rate hike. Chairman Kevin Warsh also emphasized that inflation remains above the 2% target and that the Fed will continue to prioritize restoring price stability.
Because the Fed did not raise interest rates, a further tightening of liquidity conditions was avoided in the short term, and the US dollar also briefly pulled back after the decision was announced, providing some support for Bitcoin. However, the Fed did not signal any rate cuts, instead retaining the possibility of subsequent rate hikes. For assets like Bitcoin that are highly sensitive to market liquidity and risk appetite, as long as US Treasury yields remain elevated, the room for large-scale capital to flow back into cryptocurrencies will be limited.
Spot Bitcoin ETF flows are another key narrative recently. Data from Farside shows that from July 14 to 22, US spot Bitcoin ETFs recorded net inflows for seven consecutive trading days, with a cumulative size of approximately $999 million, driving BTC to rebound from its lows toward near $67,000. However, from July 23 to 28, the ETFs recorded consecutive net outflows of about $527 million, reflecting that some institutional funds chose to take profits after the price rebound. On July 29, the ETFs resumed net inflows with $32.1 million, indicating that demand is beginning to stabilize, but the volume of capital remains insufficient to confirm a trend-based return.
Corporate demand for Bitcoin is also not as strong as in the past. MicroStrategy (MSTR) has sold approximately $218 million of Bitcoin this year to pay dividends and replenish USD reserves, and has authorized the sale of up to $1.25 billion of Bitcoin. In the past, MicroStrategy's continuous purchasing was a key bullish narrative for Bitcoin. Now, its shift from buyer to potential seller has heightened market concerns regarding the sustainability of the corporate crypto-treasury model.
However, Bitcoin's medium- to long-term fundamentals are not entirely pessimistic. The US Senate is advancing a new crypto-asset market structure bill, attempting to clarify the regulatory boundaries for the SEC, CFTC, and digital asset trading platforms. Additionally, Citadel Securities recently invested $400 million in Crypto.com, indicating that traditional financial institutions are still expanding their presence in digital asset trading, custody, and tokenization infrastructure. The gradual clarification of the regulatory framework and the steady influx of traditional capital will support Bitcoin's long-term institutionalization.
In terms of institutional views, Citi recently lowered its 12-month price target for Bitcoin from $112,000 to $82,000, primarily citing weak ETF flows, slow progress on US crypto legislation, and the possibility that corporate Bitcoin treasury holders may continue to sell assets. Citi provided a $53,000 valuation under a pessimistic scenario of an economic recession and sustained ETF outflows, indicating that while institutions still see room for recovery above current prices, they remain cautious about the sustainability of this rebound.
Bitcoin Price Technical Analysis: Break Above $67,000 Needed to Confirm Reversal
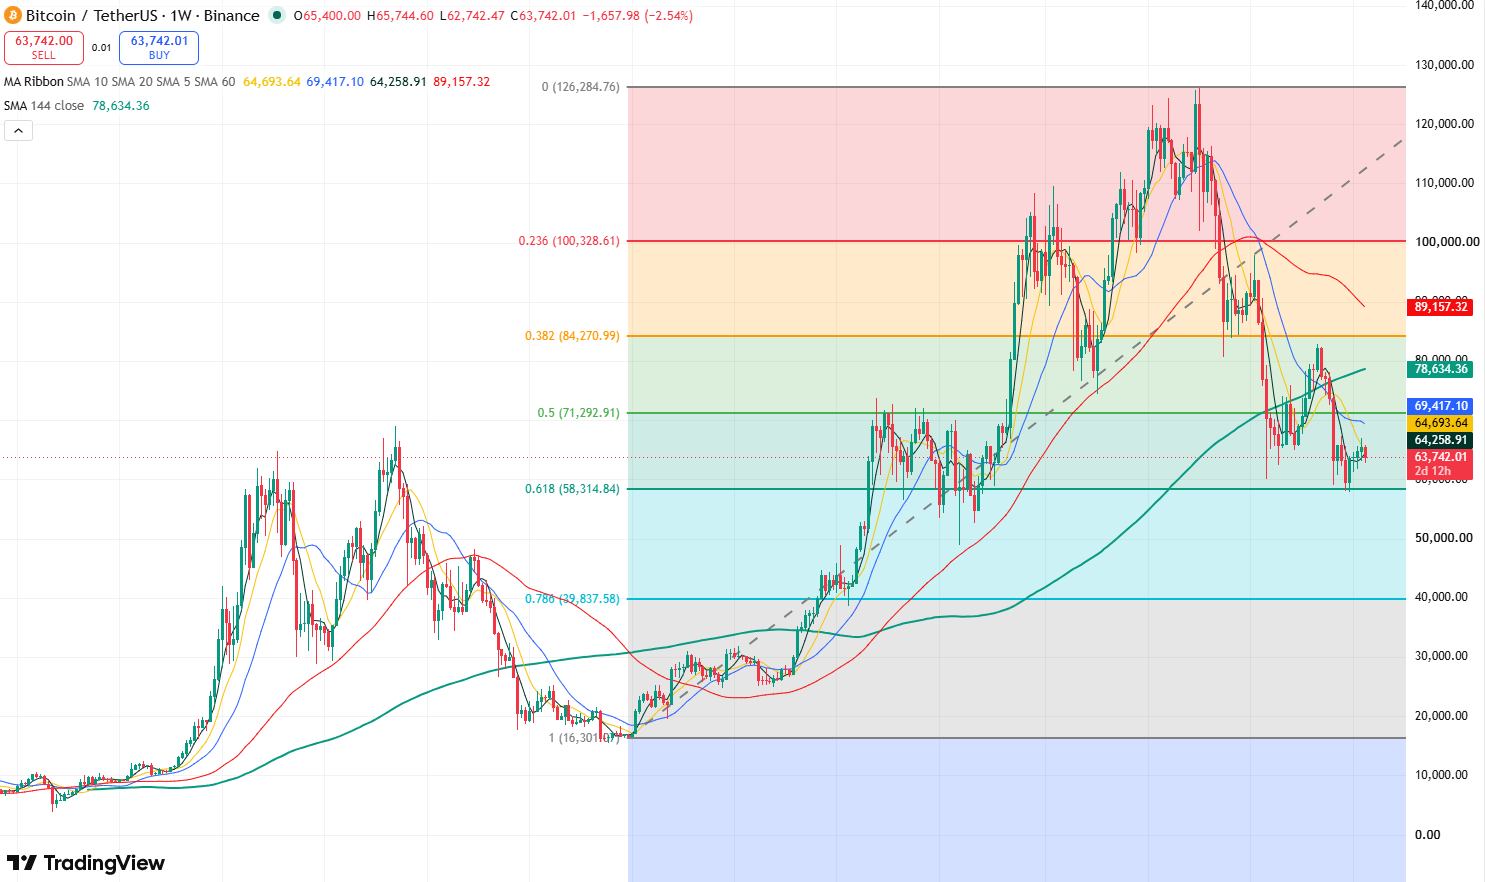
Bitcoin price weekly chart, Source: TradingView
Looking at Bitcoin's weekly chart, Bitcoin has continued to rebound from its early July low of $57,800, rising for four consecutive weeks and briefly approaching $67,000. However, it still closed below the $65,500 resistance level that week, indicating heavy selling pressure at this level. This week, it has come under pressure and weakened further, suggesting that the recent rally is merely a rebound, with market sentiment remaining bearish.
At present, the primary overhead resistance level to watch for Bitcoin is $65,500-$67,000. If the Bitcoin price can establish a firm foothold above $67,000, it will further open up upside space toward the $70,000 mark, with the next resistance zone located at $75,000-$78,000.
On the downside, Bitcoin is currently pulling back under pressure below the $65,500 resistance level and may continue to test the $60,000 mark. Below that lies $57,800; if it breaks below this point, Bitcoin will enter a deeper correction phase, potentially heading toward the $50,000 mark.
Recommended Articles


