


Will XRP Ever Break Its All-Time High? Why the 2018 Peak Is Still the Chart’s Biggest Magnet
TradingKey - XRP is one of the cryptos from the 2017-2018 bull run that still occupies a top 10 spot on assets ranked by market value. Despite XRP still being a top 10 crypto and one of the leaders of the cross-border transaction market, it carries with it one major anomaly.
While Bitcoin and Ethereum reached multiple record peaks in recent cycles, XRP’s official all-time high still dates back to January 2018. Depending on the exchange, that top sits at $3.84.
For seven years, that peak has hovered over the chart. Traders talk about it endlessly. Chartists draw lines back to it. It has become crypto’s most stubborn target. But can XRP actually break it, or is the 2018 high a permanent ceiling?
The January 2018 Ghost: Why $3.84 Acts Like a Magnet
Price charts remember history because humans do. In trading, previous record highs create strong psychological anchors. When an asset sits below a historic peak for years, two distinct forces build up.
Long-term holders who bought near the peak wait years just to break even. In addition, breakout traders view the old peak as the ultimate price magnet. Once price action moves toward it, speculative volume usually explodes.
During the 2018 mania, XRP rocketed from pennies to nearly $4 in weeks. The move was so fast that it left very little structural price support on the way up, and very little backtesting on the way down. That vertical spike created a massive gap in long-term technical structure.
When assets leave unfinished structures like that, market cycles eventually try to retest them. That is why traders treat $3.84 as a price magnet rather than just an old line on a chart.
Oversold Signals Point to a Spring-Loaded Chart
XRP rarely moves in smooth, steady lines. It tends to consolidate sideways for long stretches, boring investors, before staging sudden explosive moves.
Recent market cycles showed XRP hitting some of its most compressed conditions in years. According to Ash Crypto’s analysis on XRP’s oversold levels, momentum indicators like the Relative Strength Index (RSI) reached historical extremes.
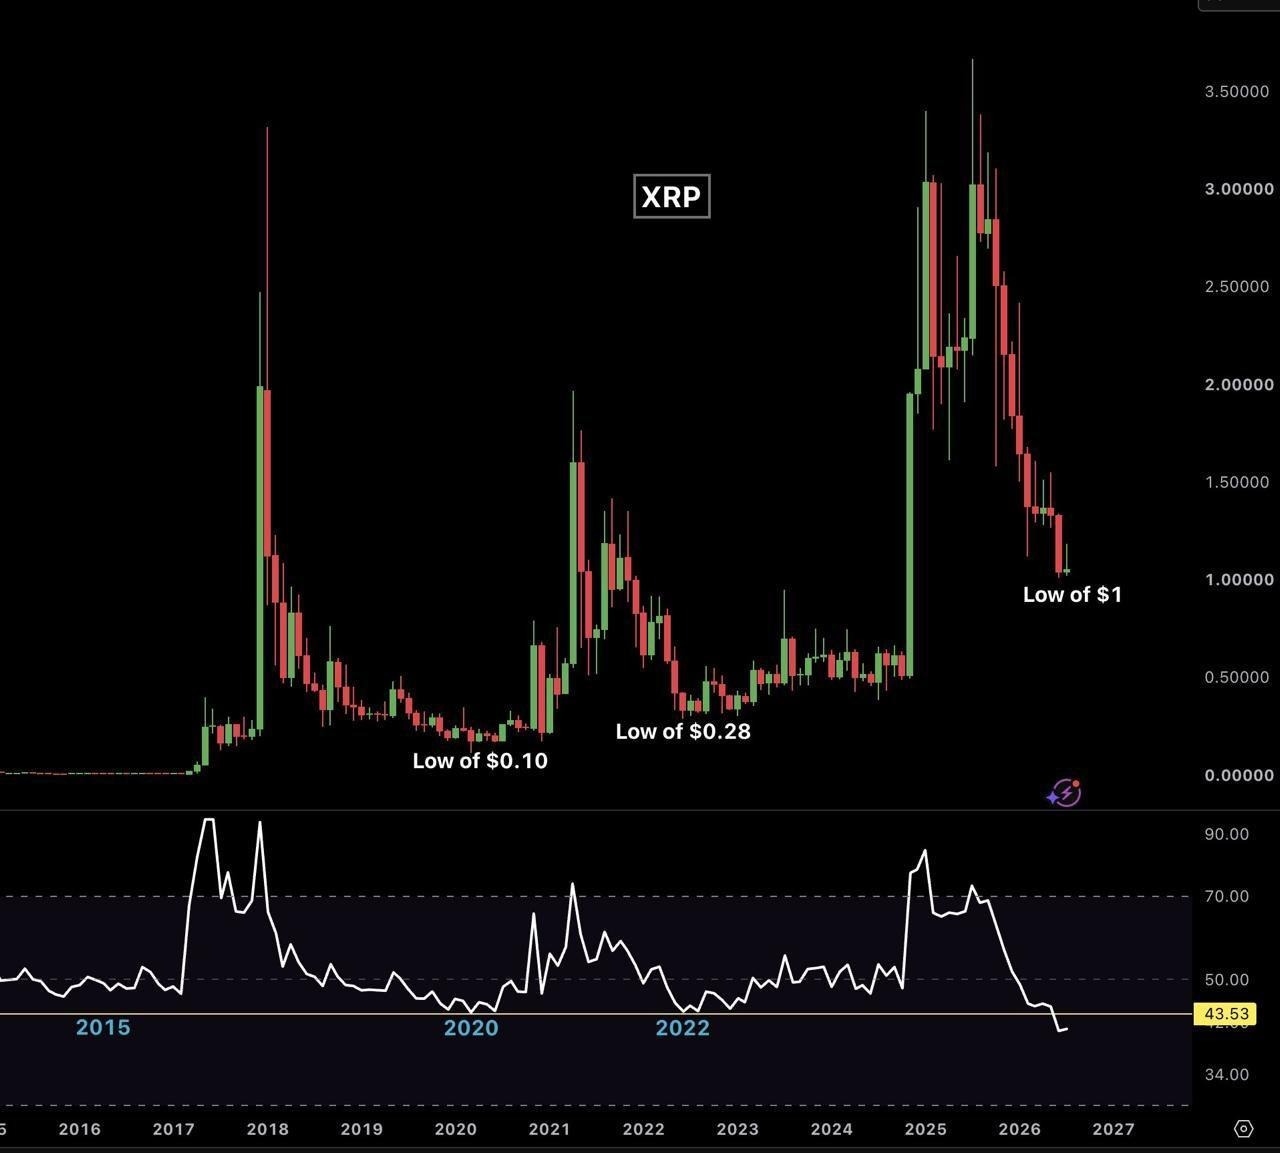
In crypto, extreme oversold conditions on higher timeframes rarely last forever. They often signal seller exhaustion. Historically, when XRP price resets its long-term technical indicators this deeply, the resulting upside moves are aggressive.
In addition to the infamous XRP’s 50,000% historical rise, the token has a proven history of multi-thousand-percent rallies once sentiment flips. So, a surge from depressed levels toward $3.00 or $4.00 fits right into its historical volatility pattern. So, why can XRP rally to $4?
Legal Clarity and Institutional Utility
The biggest difference between 2018 and today is the fundamental picture. In 2018, XRP’s rally was driven almost entirely by retail speculation and FOMO. There were few institutional products, minimal regulatory frameworks, and limited real-world utility.
Then came years of legal gridlock. The SEC lawsuit launched in late 2020 put a heavy anchor on XRP’s price, effectively suppressing its growth while the rest of the market surged in 2021. Today, that dark cloud has largely cleared:
- Legal Status: Ripple secured critical court rulings establishing that secondary sales of XRP are not securities.
- Institutional Infrastructure: Grayscale, Bitwise, and 21Shares have pushed toward XRP spot ETFs.
- Enterprise Usage: Ripple continues expanding cross-border payment networks, incorporating its USD-backed stablecoin (RLUSD) and prime brokerage services.
In a recent market breakdown, CryptoSlate evaluated how XRP could break its record high, noting that a 170% rally from intermediate resistance levels would put the token squarely inside its historic peak zone. With regulatory headwinds fading, institutional capital can finally enter without legal fear.
The Hard Math for XRP’s Return To ATH
Can XRP break $3.84 and push toward $4.00 or higher? Technically and fundamentally, yes. But investors must keep math in mind. In January 2018, XRP’s circulating supply was roughly 39 billion tokens.
Today, due to scheduled escrow releases over the years, circulating supply sits around 56 to 58 billion tokens. What does that mean for the price?
At $3.84 in 2018, XRP’s market cap was roughly $150 billion.
At $3.84 today, XRP’s market cap would need to be roughly $240 billion.
What this means is that for us to see Bitcoin rise to a new peak, more capital will need to be pumped in than it did seven years ago. A push to $4.00 or $5.00 would demand a market valuation approaching $260 billion.
That sounds high, but context matters. In a mature crypto market where total sector capitalization crosses $3 trillion to $5 trillion, a $200B+ market cap for a dominant settlement asset is entirely feasible.
Can the Magnet Pull XRP Over the Top?
Charts repeat patterns because human behavior repeats patterns. XRP has been coiled in a massive multi-year wedge structure since its 2018 high. Every time it tightens, the eventual breakout gets larger. With oversold technical indicators resetting, legal risks behind it, and institutional channels opening up, the setup is clearer than it has been in years.
XRP will likely test its $3.84 peak again. Whether it holds above that level depends on macro liquidity and broader crypto momentum. But as long as that 2018 high stands uncrossed, it will remain the single biggest magnet on the chart.
Recommended Articles


