

WhiteBIT Coin Price Forecast: WBT holds above $50 as retail demand drives rally
- WhiteBIT Coin extends gains, trading above $50.00, building on growing investor appetite.
- WBT upholds a strong derivatives market, with perpetual futures Open Interest climbing to $4.73 million.
- WhiteBIT Coin recovery potential could be capped by major moving averages despite uptrending momentum indicators.
WhiteBIT Coin (WBT) preserves a broader bullish outlook on Wednesday, trading at $51.11 at the time of writing. Valued at $6 billion in market capitalization, the token is up nearly 21% from the June lows of $42.15.
WhiteBIT Coin retail interest supports bullish bias
Retail investors exhibit a growing risk appetite for WhiteBIT Coin, with perpetual futures Open Interest (OI) expanding to $4.73 million on Wednesday, a historical high, up from $2.53 million the day before. If sustained, this surge would affirm WBT’s bullish structure and raise the odds of an extended rally.
Investors increase their exposure when they are confident in the token’s ability to sustain its short to medium-term uptrend.
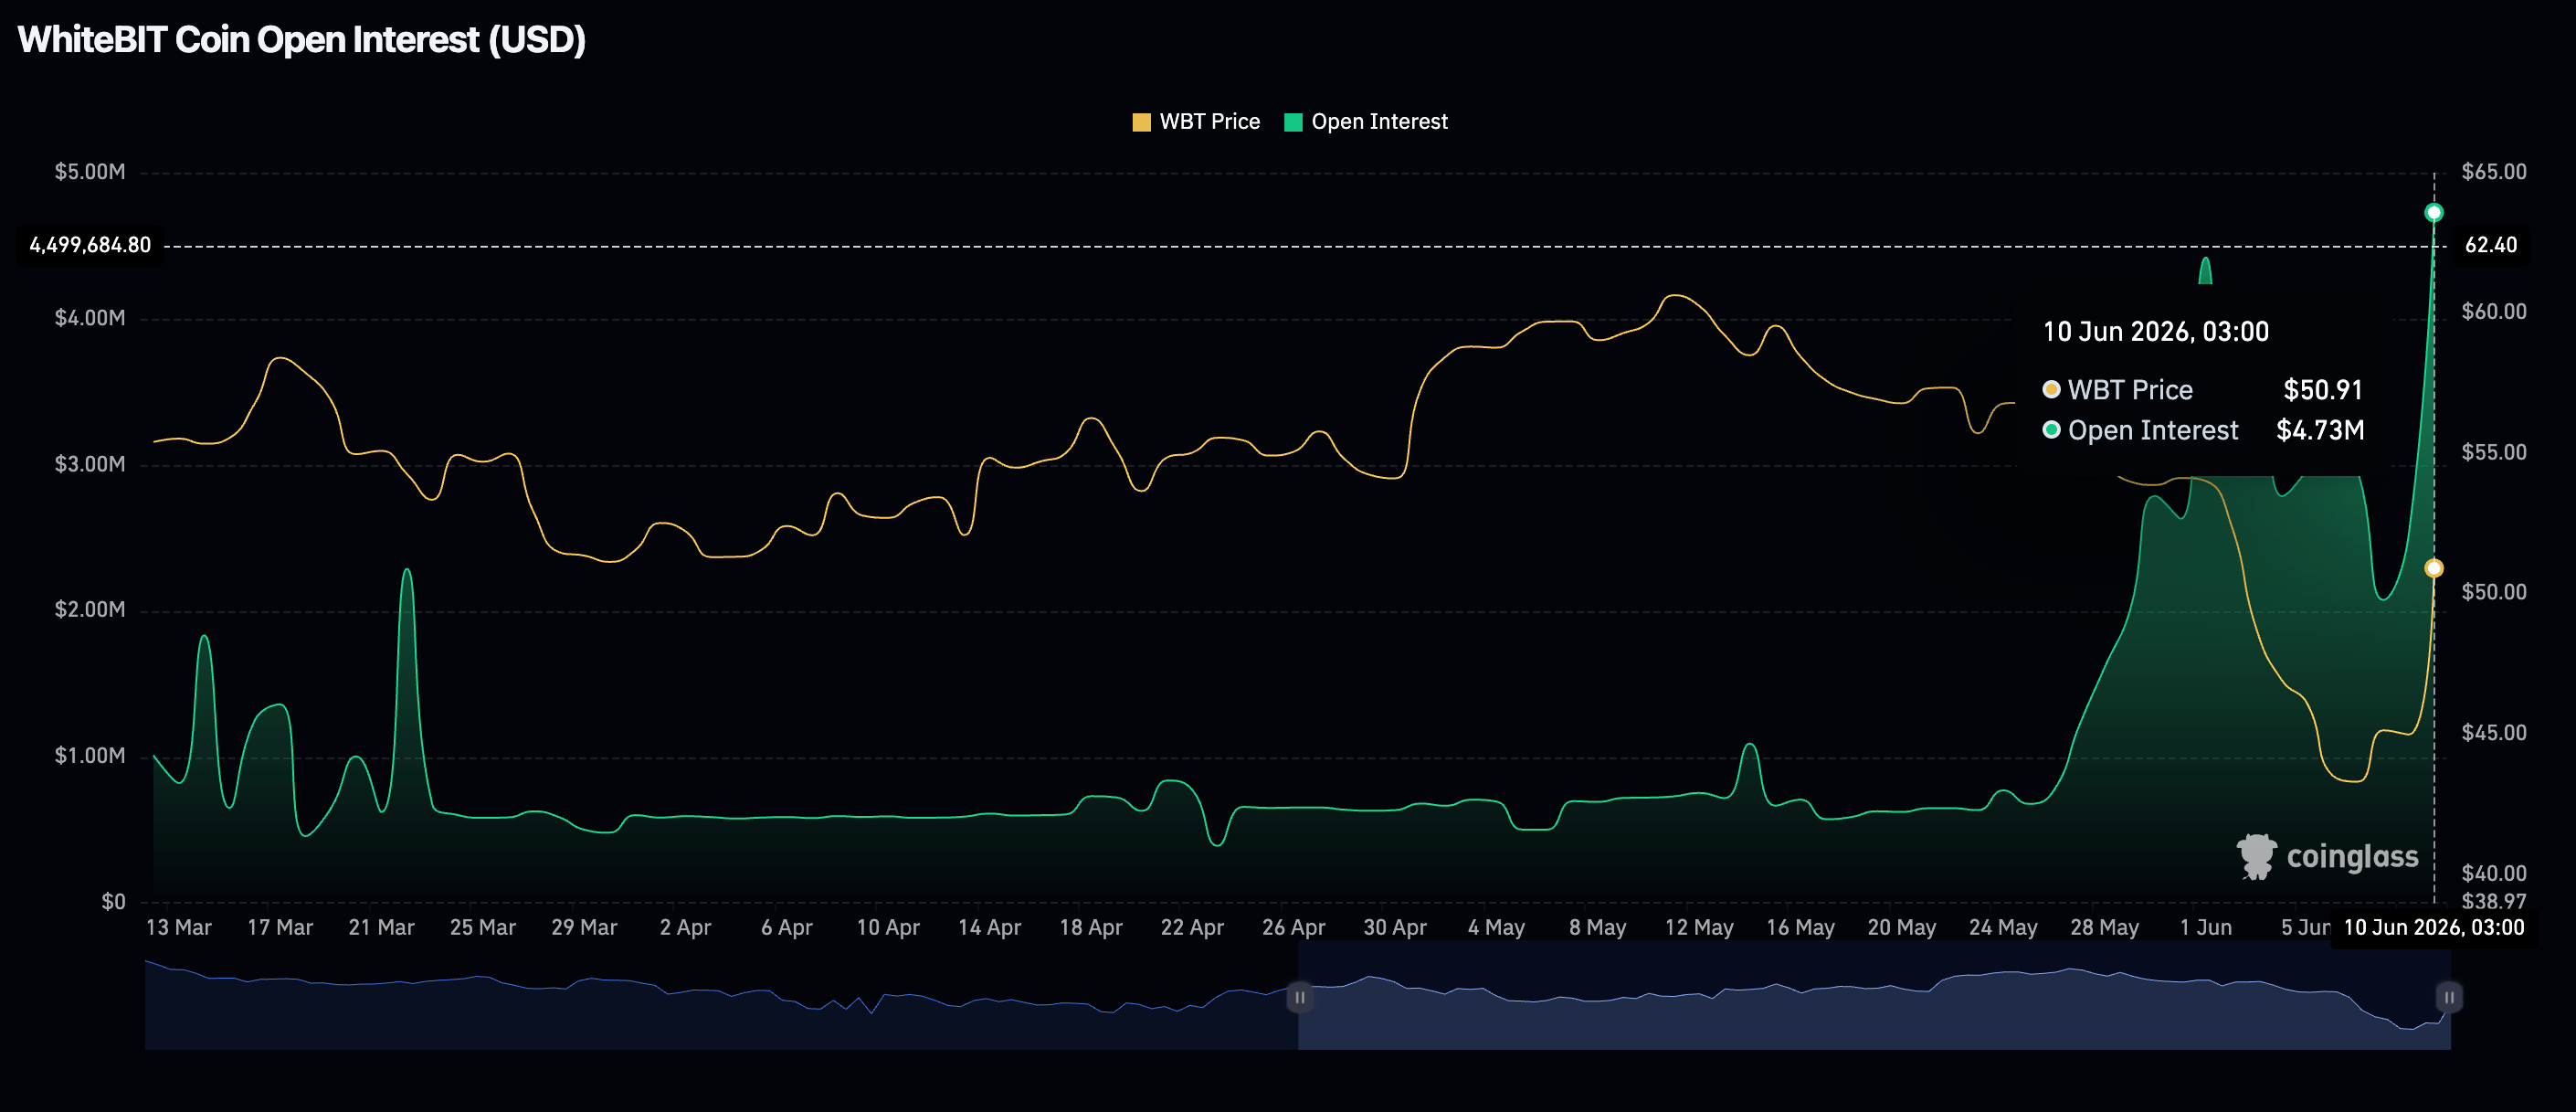
However, traders should remain cautiously optimistic, especially given the record-high OI. If WhiteBIT Coin fails to breach the next key resistance, liquidations could weigh on the price as headwinds intensify.
Price analysis: WhiteBIT Coin technical structure leans bullish
WhiteBIT Coin is trading around $51.15, extending its rally for a second consecutive day. The token builds on momentum above psychological resistance-turned-support levels at $45.00 and $50.00.
Momentum remains intact, grounded by the Moving Average Convergence Divergence (MACD) indicator, with a contracting histogram likely to trigger a buy signal in the short term.
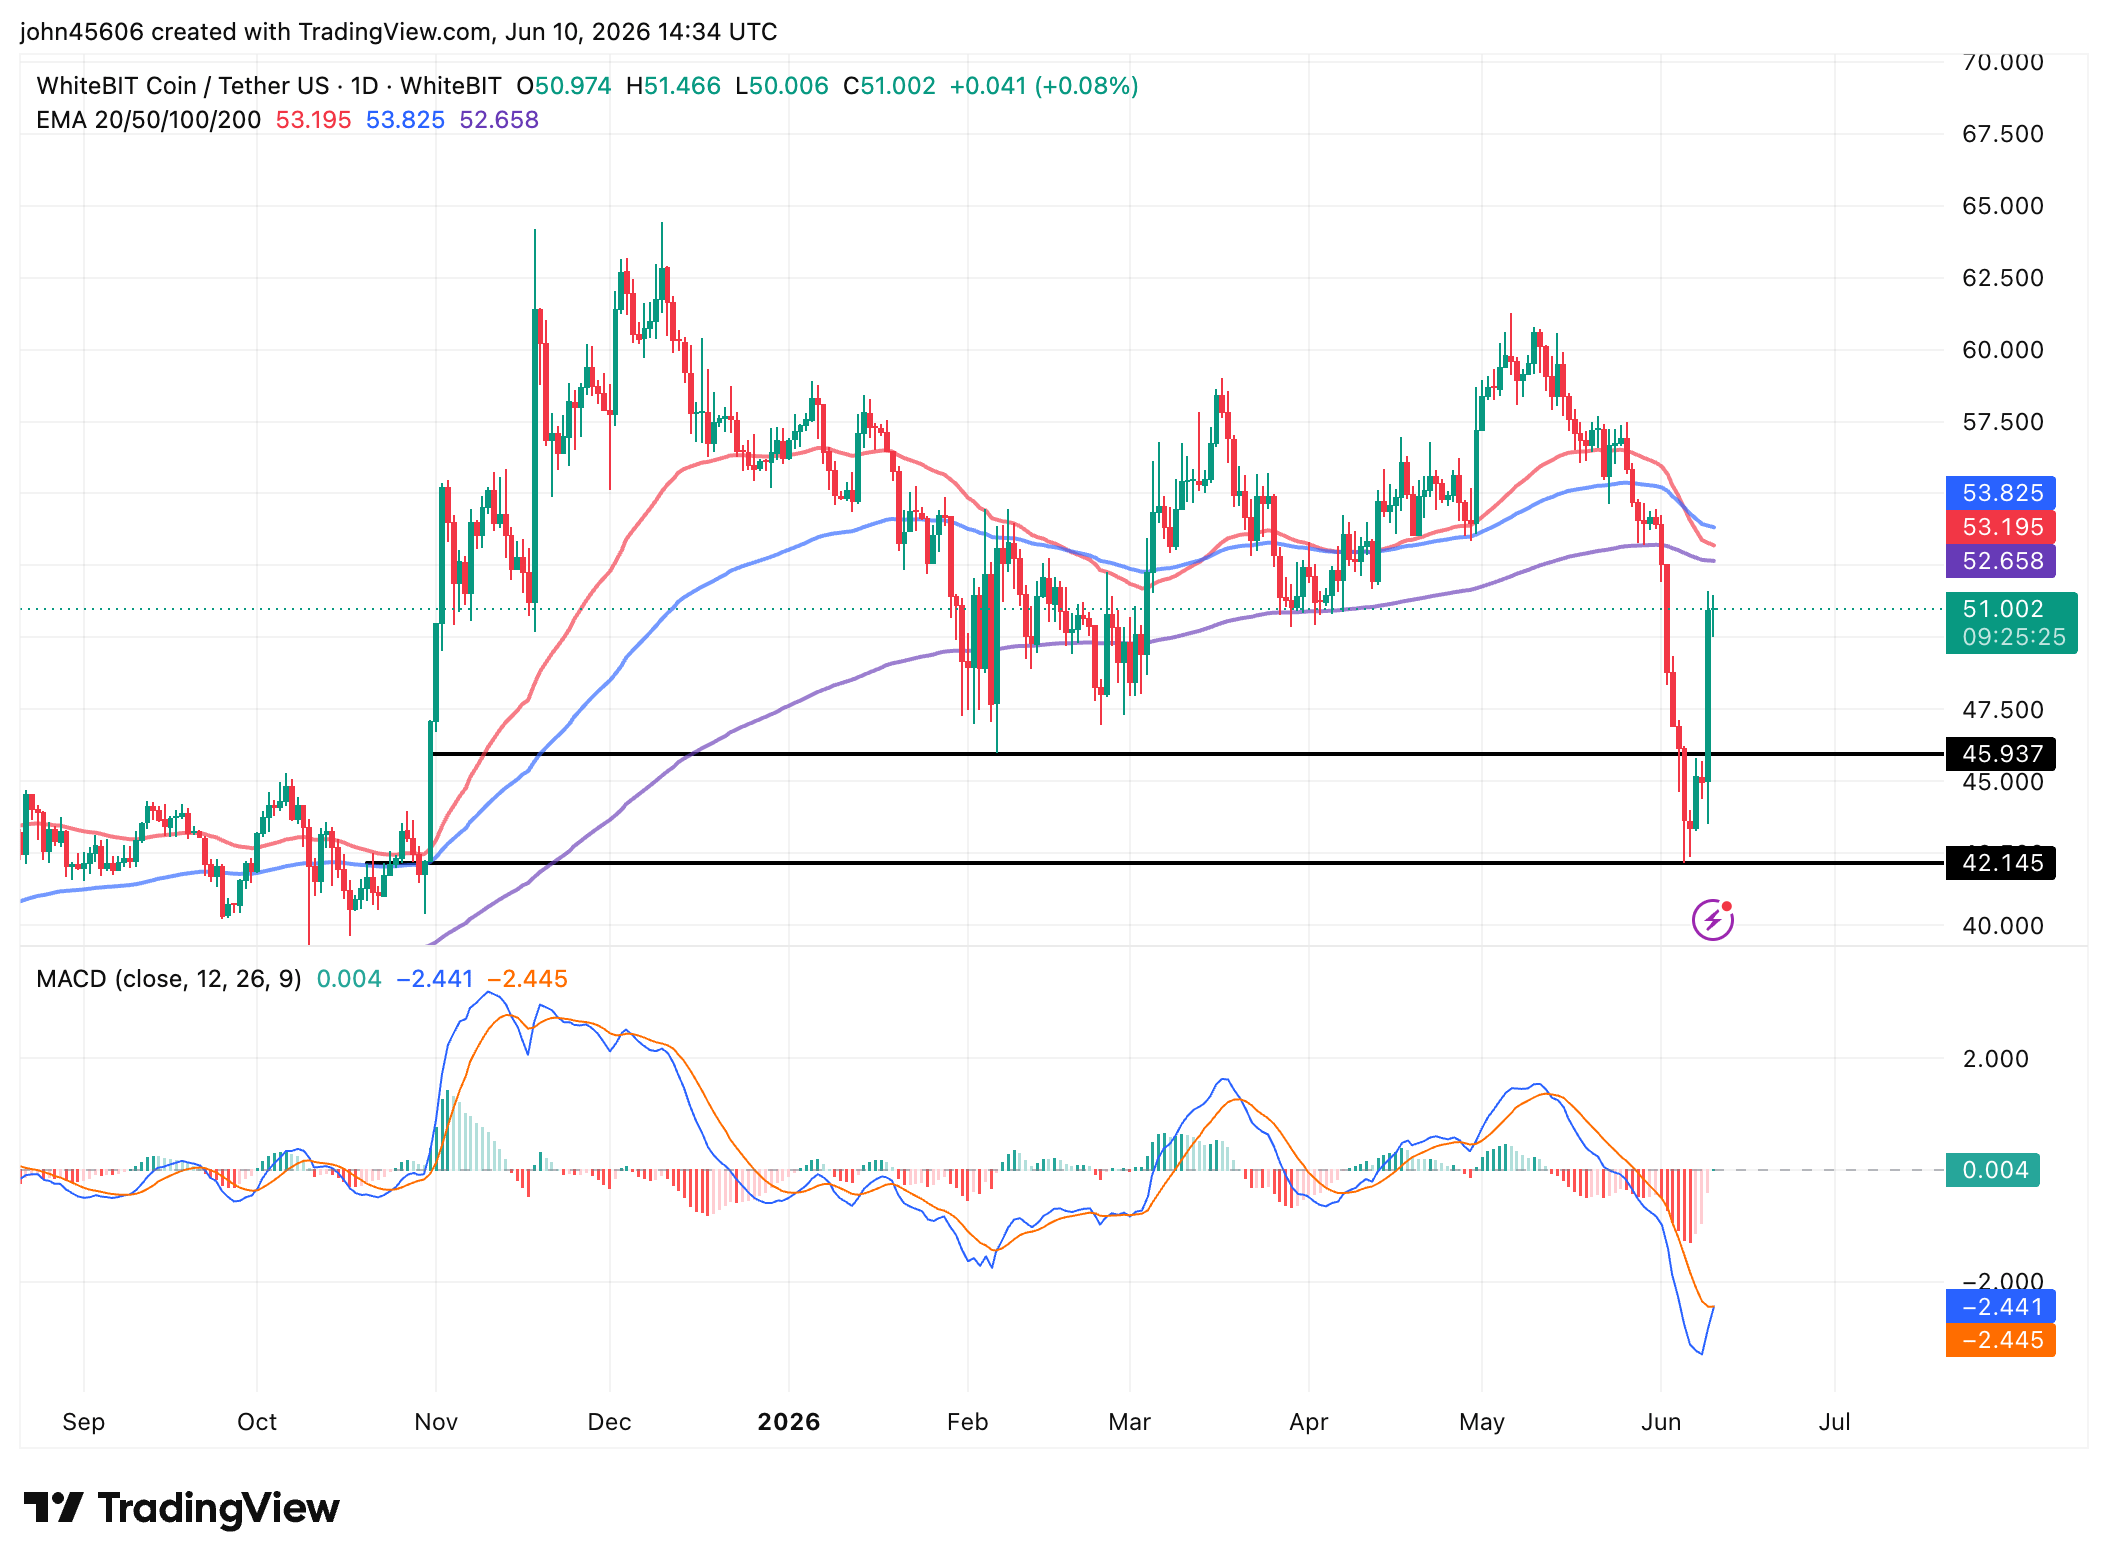
On the topside, WhiteBIT Coin hovers below the 200-day Exponential Moving Average (EMA) initial resistance at $52.66, followed by the 50-day EMA at $53.02 and the 100-day EMA at $53.82.
Unless WBT rises above the moving average cluster, the odds of an extended rally would begin to fade, while rejection could be interpreted as a signal to book profits. Consequently, this could trigger a correction.
A reversal from current levels would encourage late-entry investors to engage at psychological round-figure support levels, including $45.00 and $40.00.
Open Interest, funding rate FAQs
Higher Open Interest is associated with higher liquidity and new capital inflow to the market. This is considered the equivalent of increase in efficiency and the ongoing trend continues. When Open Interest decreases, it is considered a sign of liquidation in the market, investors are leaving and the overall demand for an asset is on a decline, fueling a bearish sentiment among investors.
Funding fees bridge the difference between spot prices and prices of futures contracts of an asset by increasing liquidation risks faced by traders. A consistently high and positive funding rate implies there is a bullish sentiment among market participants and there is an expectation of a price hike. A consistently negative funding rate for an asset implies a bearish sentiment, indicating that traders expect the cryptocurrency’s price to fall and a bearish trend reversal is likely to occur.
Recommended Articles


