

British Pound hovers near 1.3400 as hot US CPI weighs on the USD
- US CPI hits three-year high, but Dollar slips afterward.
- Middle East flare-up keeps markets cautious before PPI release.
- BoE hike bets support Sterling ahead of UK GDP.
The Pound Sterling rose by over 0.19% on Wednesday after US inflation matched estimates, though the headline Consumer Price Index (CPI) reached a three-year high. The GBP/USD trades near 1.3400 after bouncing off daily lows of 1.3362.
US-Iran exchange fire, talks stall
Tensions in the Middle East remained high even though newswires revealed that the US and Iran might be close to finding common ground regarding Tehran’s uranium enrichment program. Nevertheless, talks took a step back as Iran shot down a US helicopter, which triggered a retaliation by Washington.
Prices in the US rise, traders eye a Fed rate hike
Data from the US reflected the impact of the Iran war as the CPI in May met expectations at 4.2% YoY, up from April’s 3.8% print. Core CPI, which excludes volatile items, expanded by 2.9% YoY, as expected, up from 2.8%.
Despite registering red-hot inflation, the Greenback is on the back foot, according to the US Dollar Index (DXY). The DXY, which measures the buck's performance against six currencies, is down 0.11% to 99.87.
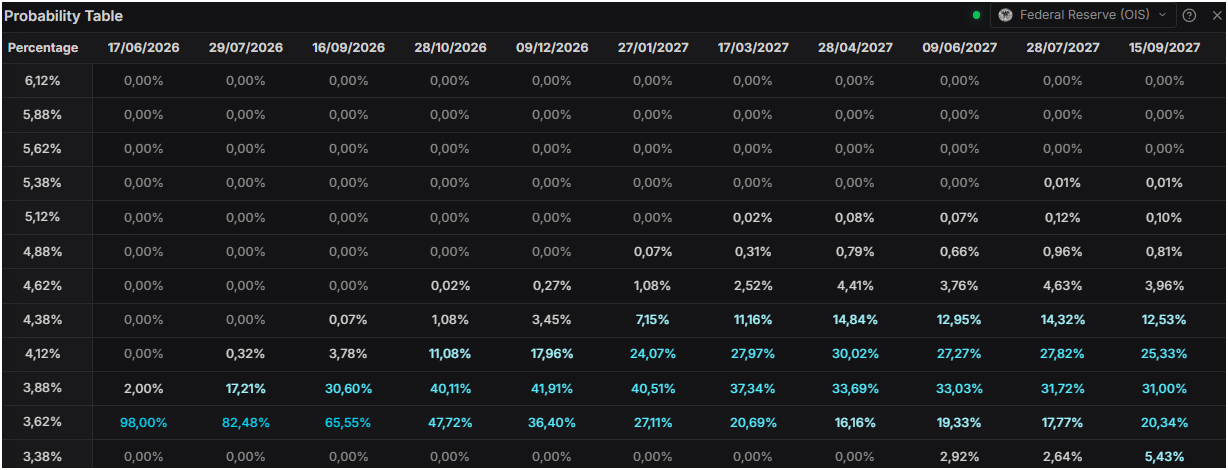
Meanwhile, money markets speculate with a potential Federal Reserve rate hike towards the end of the year, with traders pricing 22 basis points of tightening.
Sterling is underpinned by interest rate probabilities
In the UK, the British Pound remains underpinned by investor expectations of 44 basis points of rate hikes by the Bank of England (BoE) toward the end of 2026. The markets' focus shifts to the release of Gross Domestic Product (GDP) figures on Friday.
In the US, traders would focus on the release of Initial Jobless Claims data and the May Producer Price Index (PPI).
GBP/USD Price Forecast: Technical outlook
In the daily chart, GBP/USD trades at 1.3392, holding a mildly bearish near-term bias as price sits under the latest triple simple moving average cluster around 1.3461 and below the reclaimed breakout area of the former rising trend line at 1.3408. The Relative Strength Index (14) at roughly 45 keeps momentum on the soft side of neutral, suggesting sellers retain the upper hand while the pair struggles to regain its lost support zone.
On the topside, immediate resistance is now located near 1.3408, where the broken upward trend-line area turns into a nearby cap, followed by the triple simple moving average around 1.3461. Above that, the bearish diagonal structure remains in play, with further resistance at the prior break level of the descending trend line at 1.3573 and then at its origin near 1.3869. On the downside, structural support is distant, with the rising trend-line anchor around 1.3159 emerging as the next key floor if selling pressure resumes.
(The technical analysis of this story was written with the help of an AI tool.)
Pound Sterling Price Today
The table below shows the percentage change of British Pound (GBP) against listed major currencies today. British Pound was the strongest against the Australian Dollar.
| USD | EUR | GBP | JPY | CAD | AUD | NZD | CHF | |
|---|---|---|---|---|---|---|---|---|
| USD | -0.07% | -0.05% | 0.06% | -0.12% | 0.10% | -0.14% | 0.03% | |
| EUR | 0.07% | 0.00% | 0.15% | -0.09% | 0.12% | -0.06% | 0.10% | |
| GBP | 0.05% | -0.00% | 0.13% | -0.07% | 0.14% | -0.06% | 0.10% | |
| JPY | -0.06% | -0.15% | -0.13% | -0.20% | -0.00% | -0.21% | -0.06% | |
| CAD | 0.12% | 0.09% | 0.07% | 0.20% | 0.20% | -0.01% | 0.14% | |
| AUD | -0.10% | -0.12% | -0.14% | 0.00% | -0.20% | -0.20% | -0.04% | |
| NZD | 0.14% | 0.06% | 0.06% | 0.21% | 0.00% | 0.20% | 0.16% | |
| CHF | -0.03% | -0.10% | -0.10% | 0.06% | -0.14% | 0.04% | -0.16% |
The heat map shows percentage changes of major currencies against each other. The base currency is picked from the left column, while the quote currency is picked from the top row. For example, if you pick the British Pound from the left column and move along the horizontal line to the US Dollar, the percentage change displayed in the box will represent GBP (base)/USD (quote).
Recommended Articles


