

Crypto Today: Bitcoin, Ethereum, XRP extend sell-off as US-Iran ongoing talks fail to lift risk appetite
- Bitcoin slides and hovers around $70,000 on Tuesday as Trump’s statement about an imminent deal with Iran fails to lift sentiment.
- Ethereum remains below $2,000, weighed down by increasing selling pressure and ETF outflows.
- XRP drops toward $1.25 support as mild inflows into US-listed spot ETFs last week fail to absorb overhead pressure.
Cryptocurrencies remain broadly pressured on Monday, with Bitcoin (BTC) hovering around $70,000, Ethereum (ETH) below $2,000, and Ripple (XRP) near $0.25. Appetite for risk assets has remained significantly subdued amid the tensions in the Middle East despite optimism for an imminent peace deal between the United States (US) and Iran.
US and Iran restart peace negotiations
US President Donald Trump said on Monday that he called Israeli Prime Minister Benjamin Netanyahu and asked him not to proceed with a major raid on Beirut, and that Israeli troops were turned around.
Trump also told ABC News that he believes a deal to reopen the Strait of Hormuz and extend the ceasefire with Iran is reachable “over the next week.” Moreover, citing a regional source, a CNN report highlighted that US-Iran negotiations were back on track, hours after Iran suspended talks over Israel’s offensive in Lebanon.
Despite Trump’s optimism, sentiment remains on the back foot, with outflows from spot BTC and ETH spot Exchange-Traded Funds (ETFs) for the fourth consecutive week.
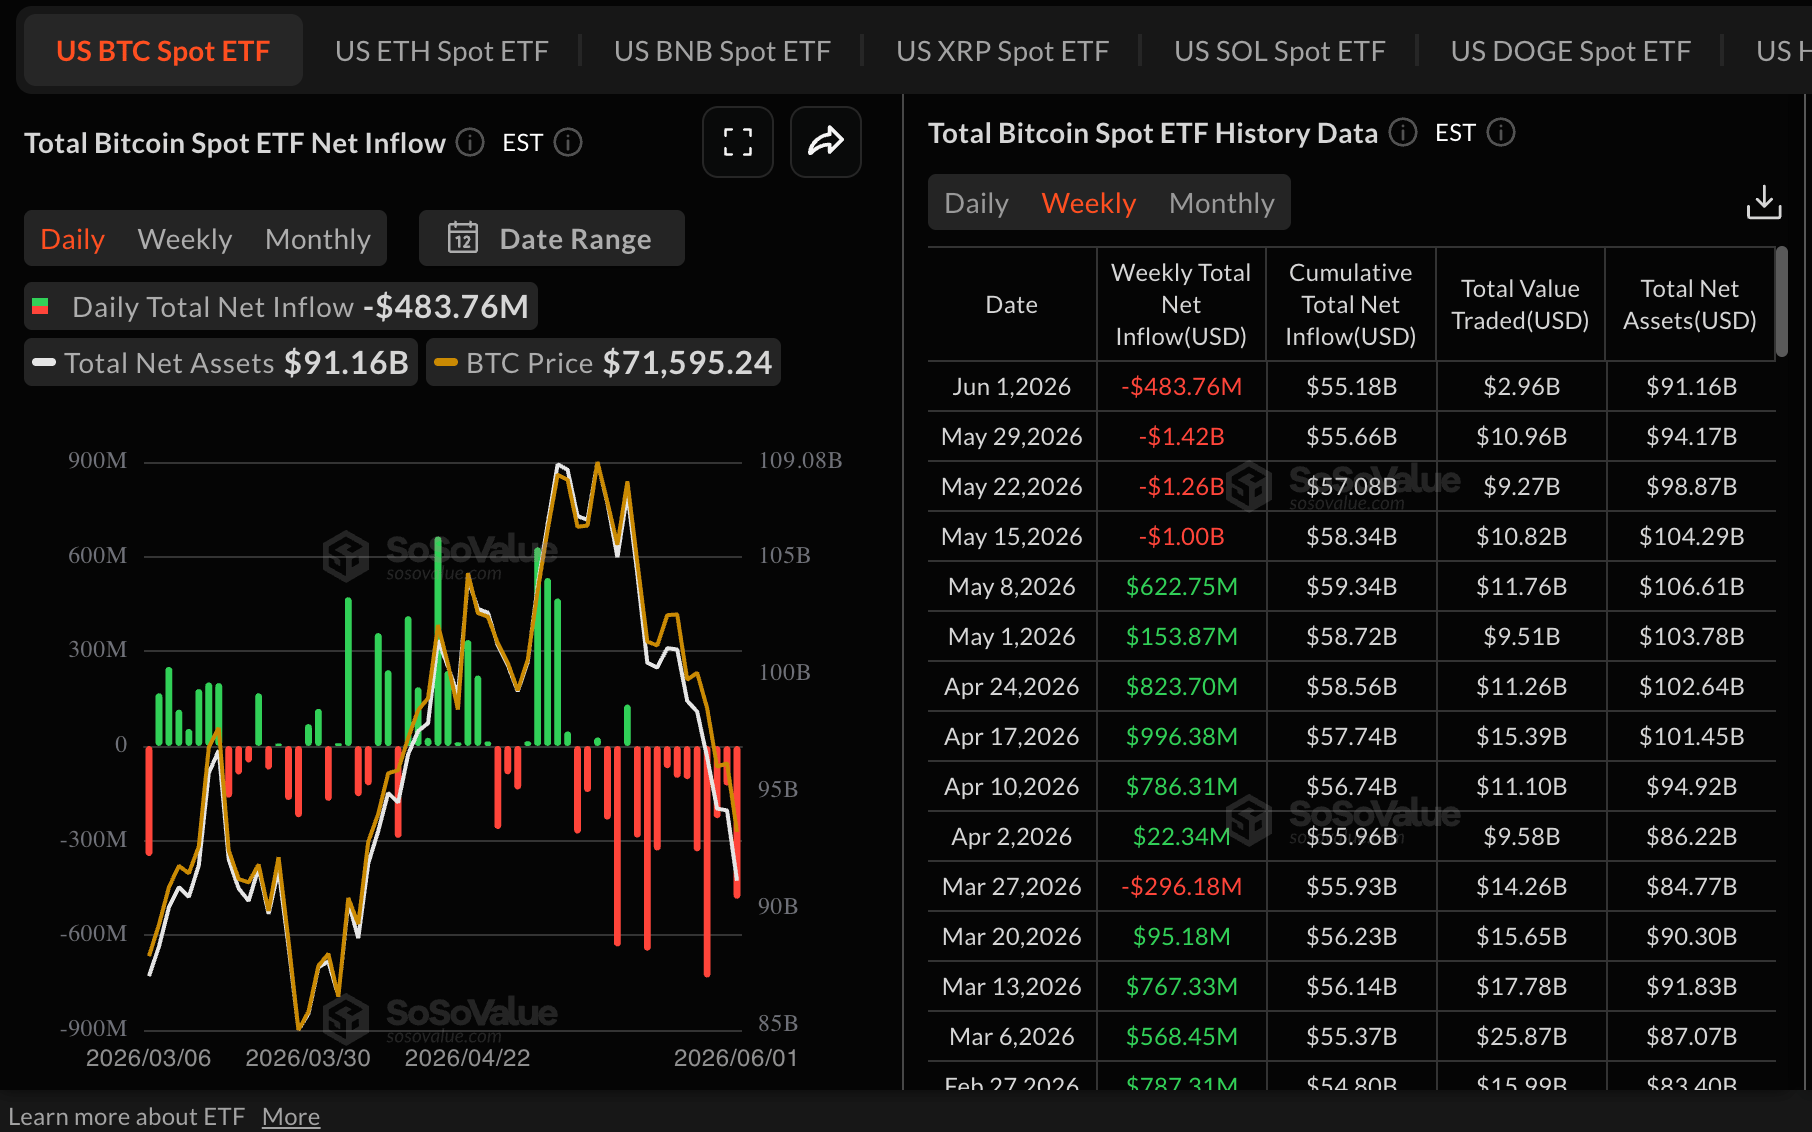
Bitcoin ETF outflows totaled $484 million last week, bringing cumulative inflows down to $55.18 billion and assets under management to $91.16 billion.
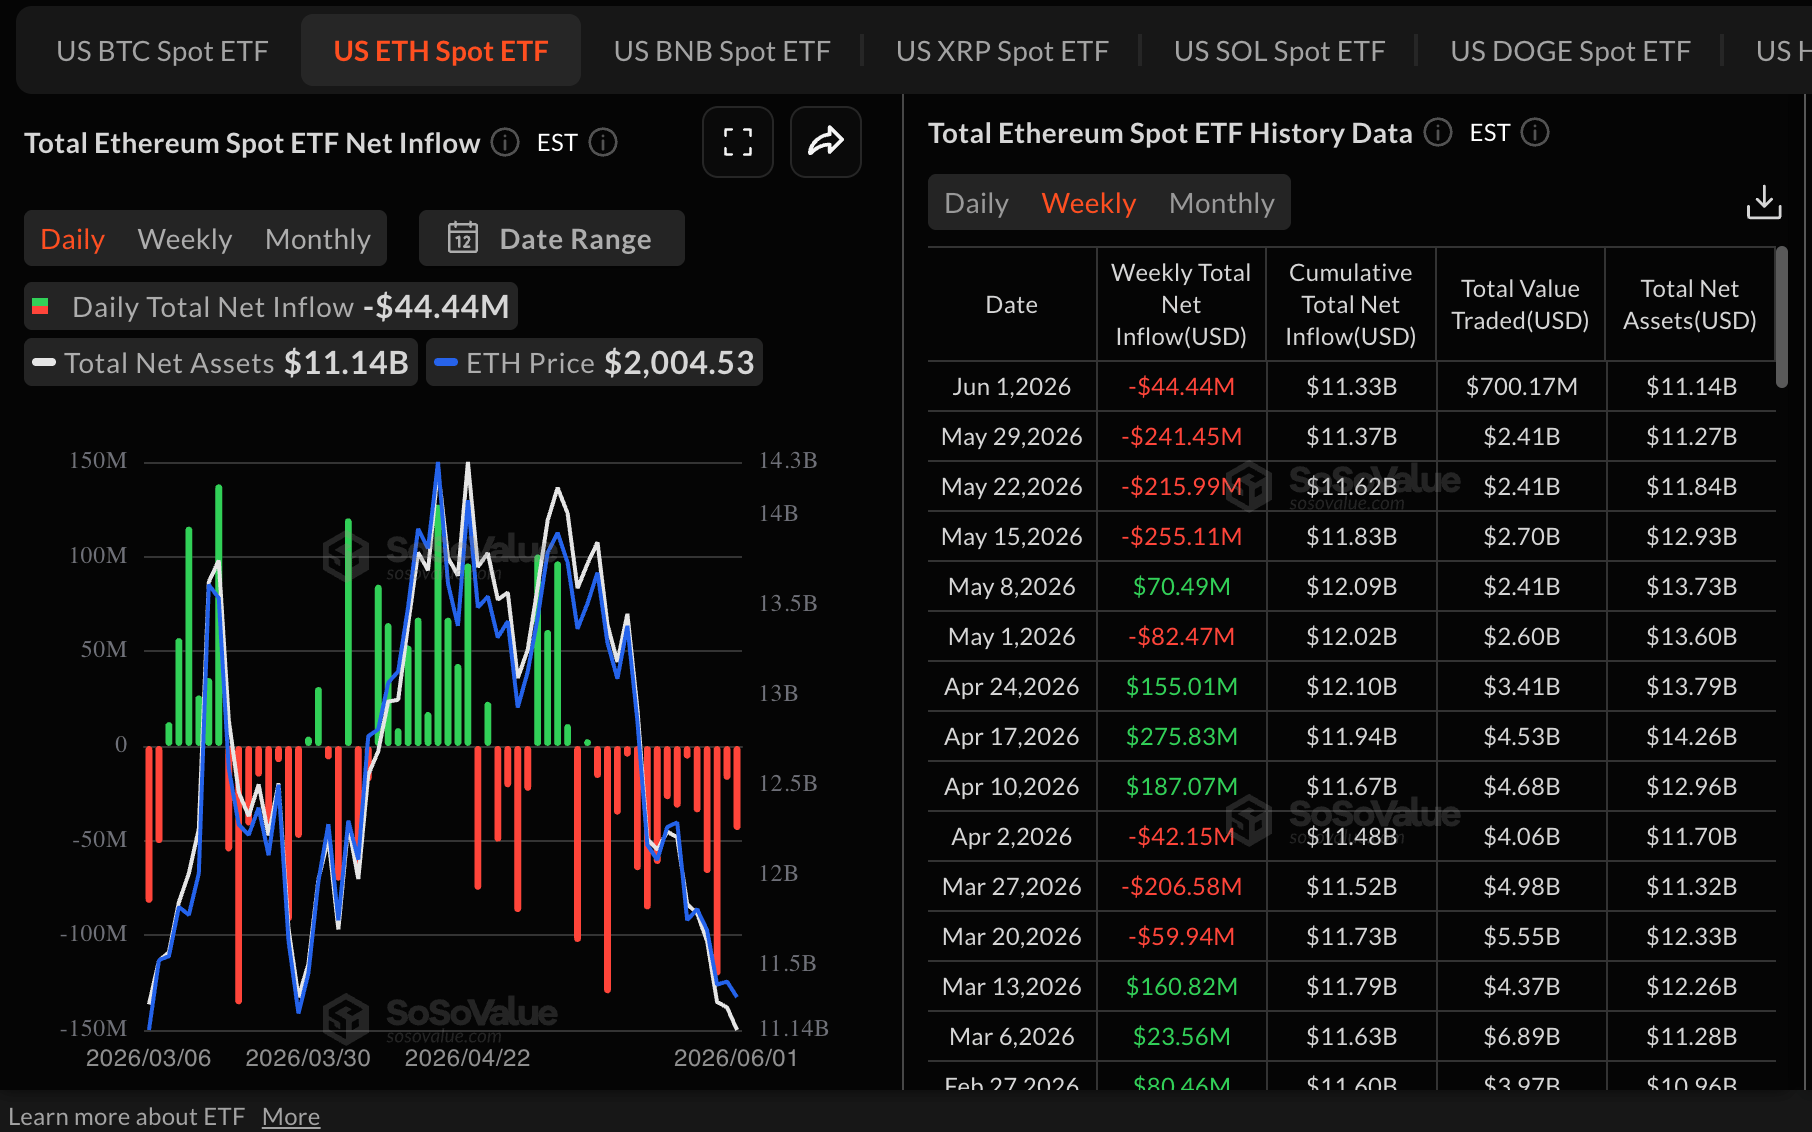
Ethereum ETFs experienced another week of outflows totaling $44.44 million through June 1. Cumulative inflows average $11.33 billion, with net assets under management standing at $11.14 billion, according to SoSoValue data.
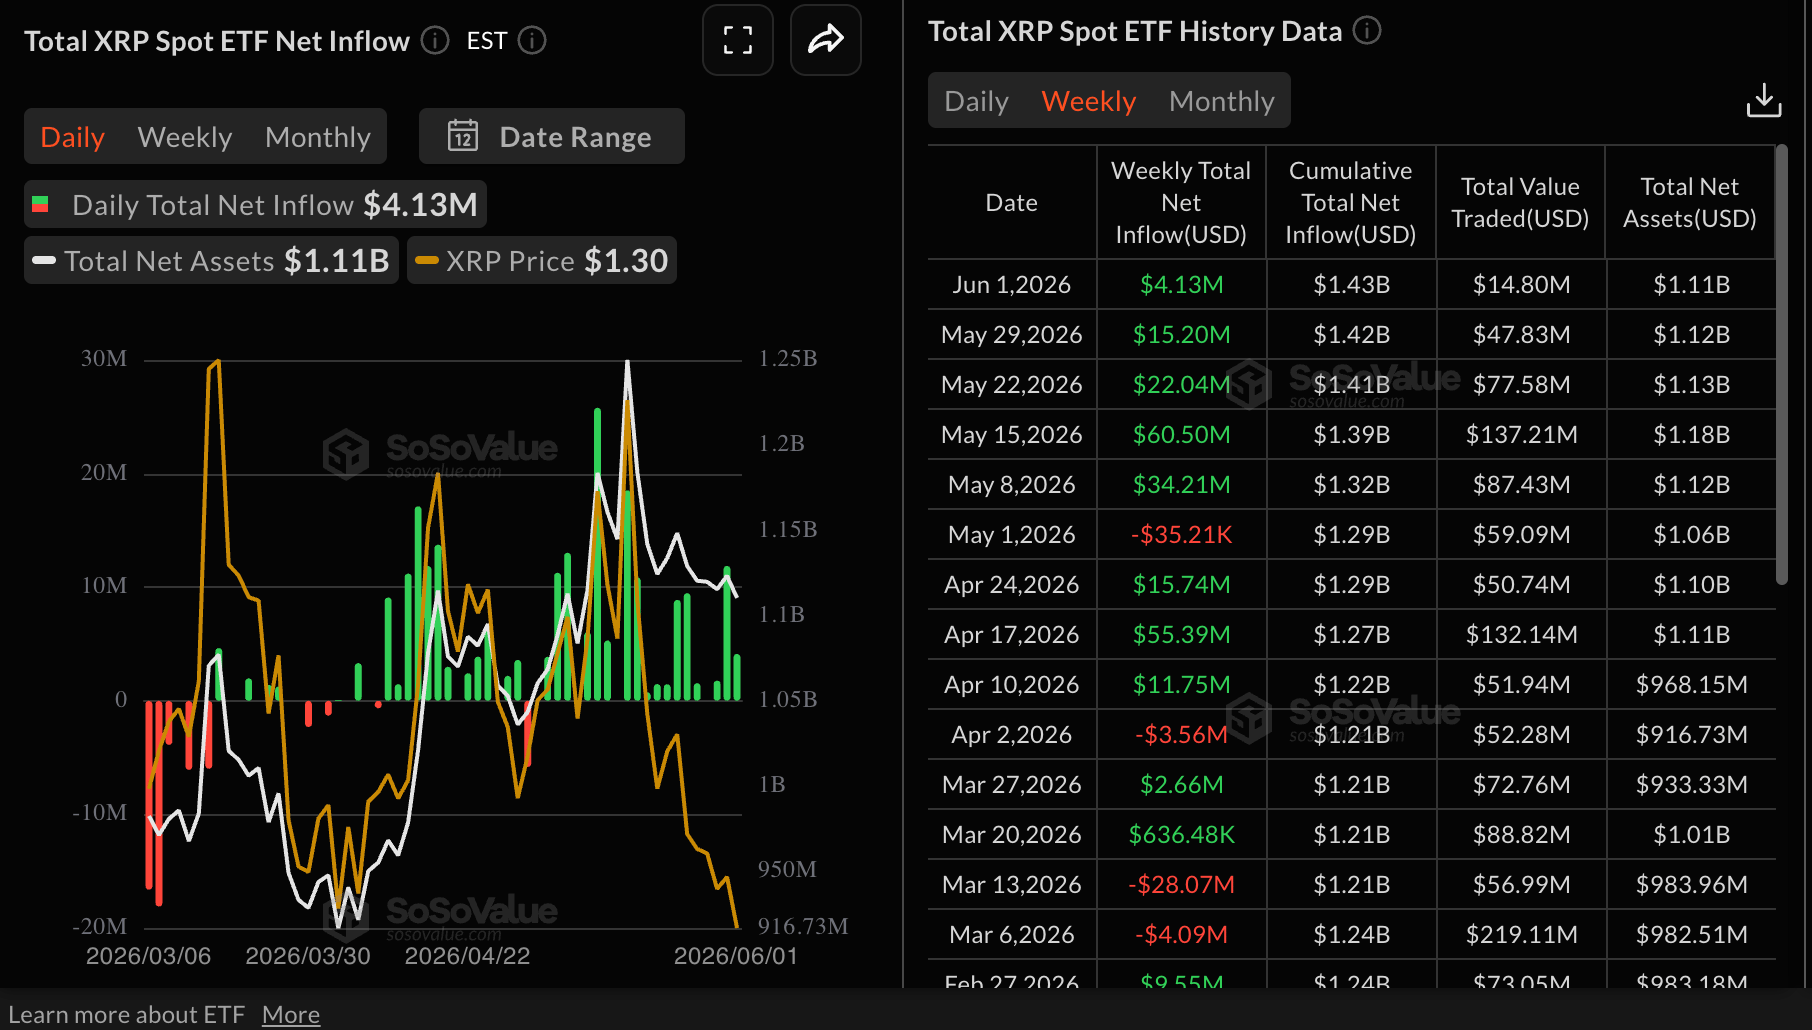
Meanwhile, XRP spot ETFs beat the odds to post mild inflows of $4.13 million last week, extending the bullish streak for five consecutive weeks. Cumulative inflows average $1.43 billion, with net assets under management standing at $1.11 billion.
Price analysis: Bitcoin tests lifeline support
Bitcoin trades around $70,000, keeping a bearish near-term tone as it holds below a dense band of moving average resistance. The 50-day Exponential Moving Average (EMA) at $75,796, the 100-day EMA at $76,342, and the 200-day EMA near $80,810 all sit overhead, suggesting rallies are likely to be capped while price remains entrenched beneath these trend gauges.
Momentum has deteriorated, with the Relative Strength Index (RSI) slipping into oversold territory around 27 on the daily chart, hinting that downside pressure is stretched but not yet showing a clear reversal signal as the Moving Average Convergence Divergence (MACD) histogram remains in negative territory with persistent bearish readings.
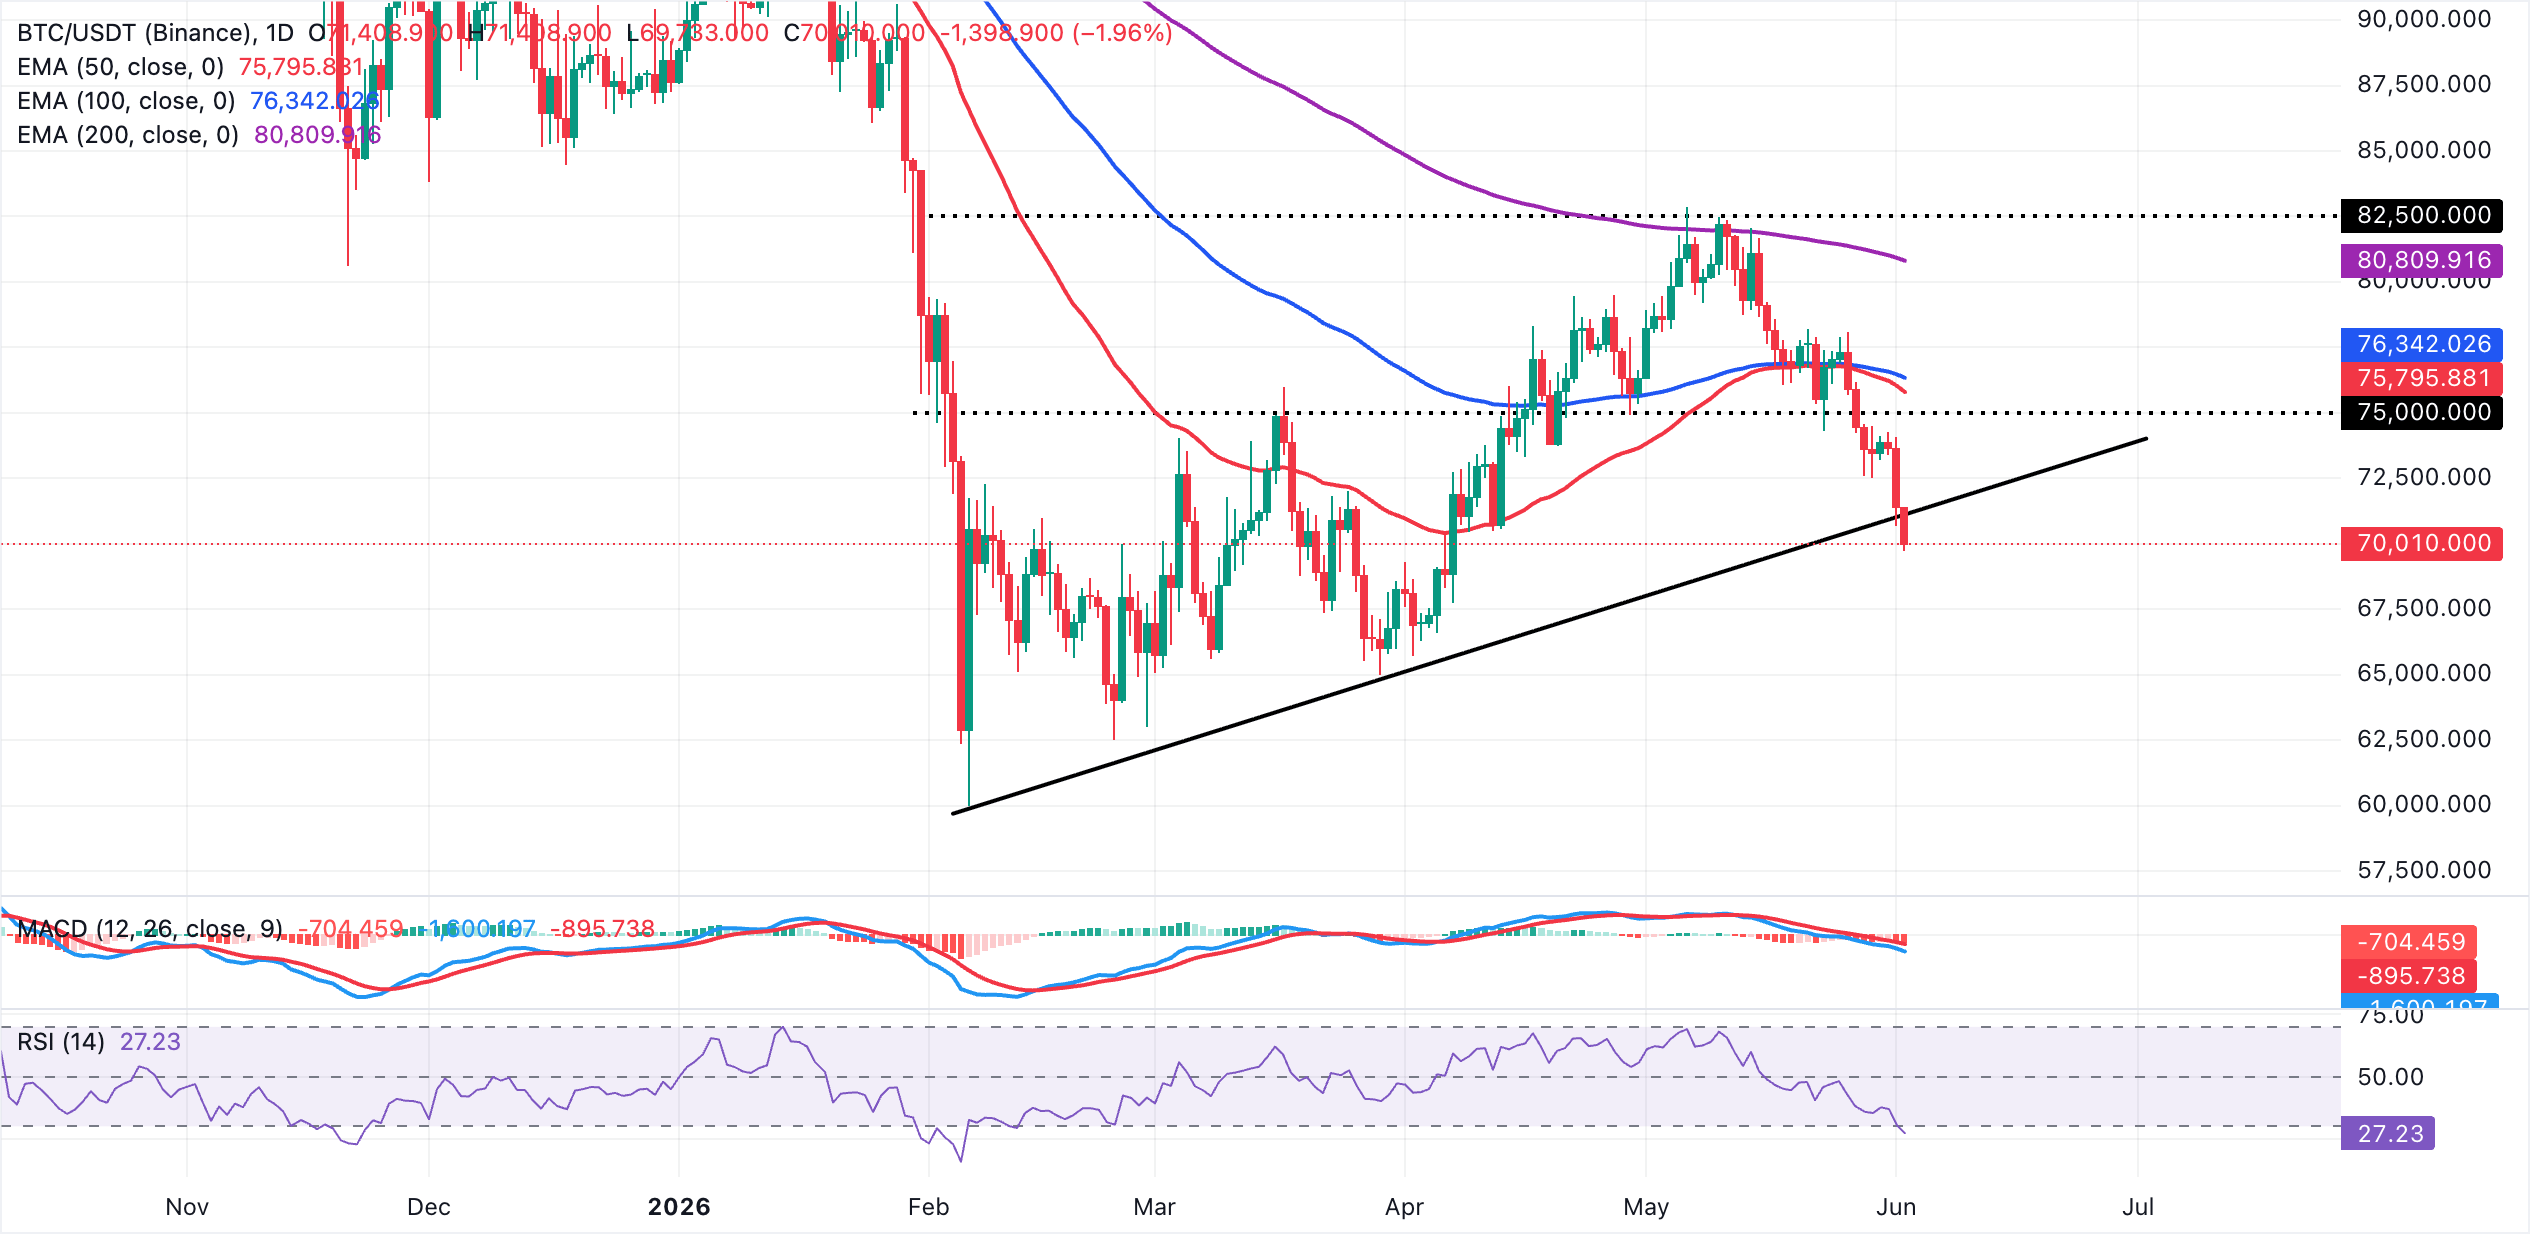
On the topside, initial resistance lies at the former rising support trend line, now a barrier around $71,153.60, where any rebound could first stall. Above that, the 50-day EMA at 75,796 and the 100-day EMA at $76,342 form a secondary supply zone, ahead of the more substantial 200-day EMA near $80,810, which defines the broader bearish cap. A sustained break above these layers would start to ease the prevailing downward bias. However, if the sell-off intensifies and the pivotal $70,000 turns into resistance, Bitcoin may extend the losses toward $65,000.
Altcoins technical outlook: Ethereum and XRP slide amid increasing supply
Ethereum trades at $1,984, extending a bearish phase after slipping well beneath its short and medium-term moving averages. The 50-day EMA at $2,166, the 100-day EMA at $2,256 and the 200-day EMA at $2,479 all sit overhead, suggesting the broader trend remains pressured while price holds below this stacked resistance band.
Momentum underscores the weak tone, with the RSI hovering in oversold territory near 30 on the daily chart and the MACD histogram remaining negative, which hints that selling pressure persists despite the risk of intermittent corrective bounces.
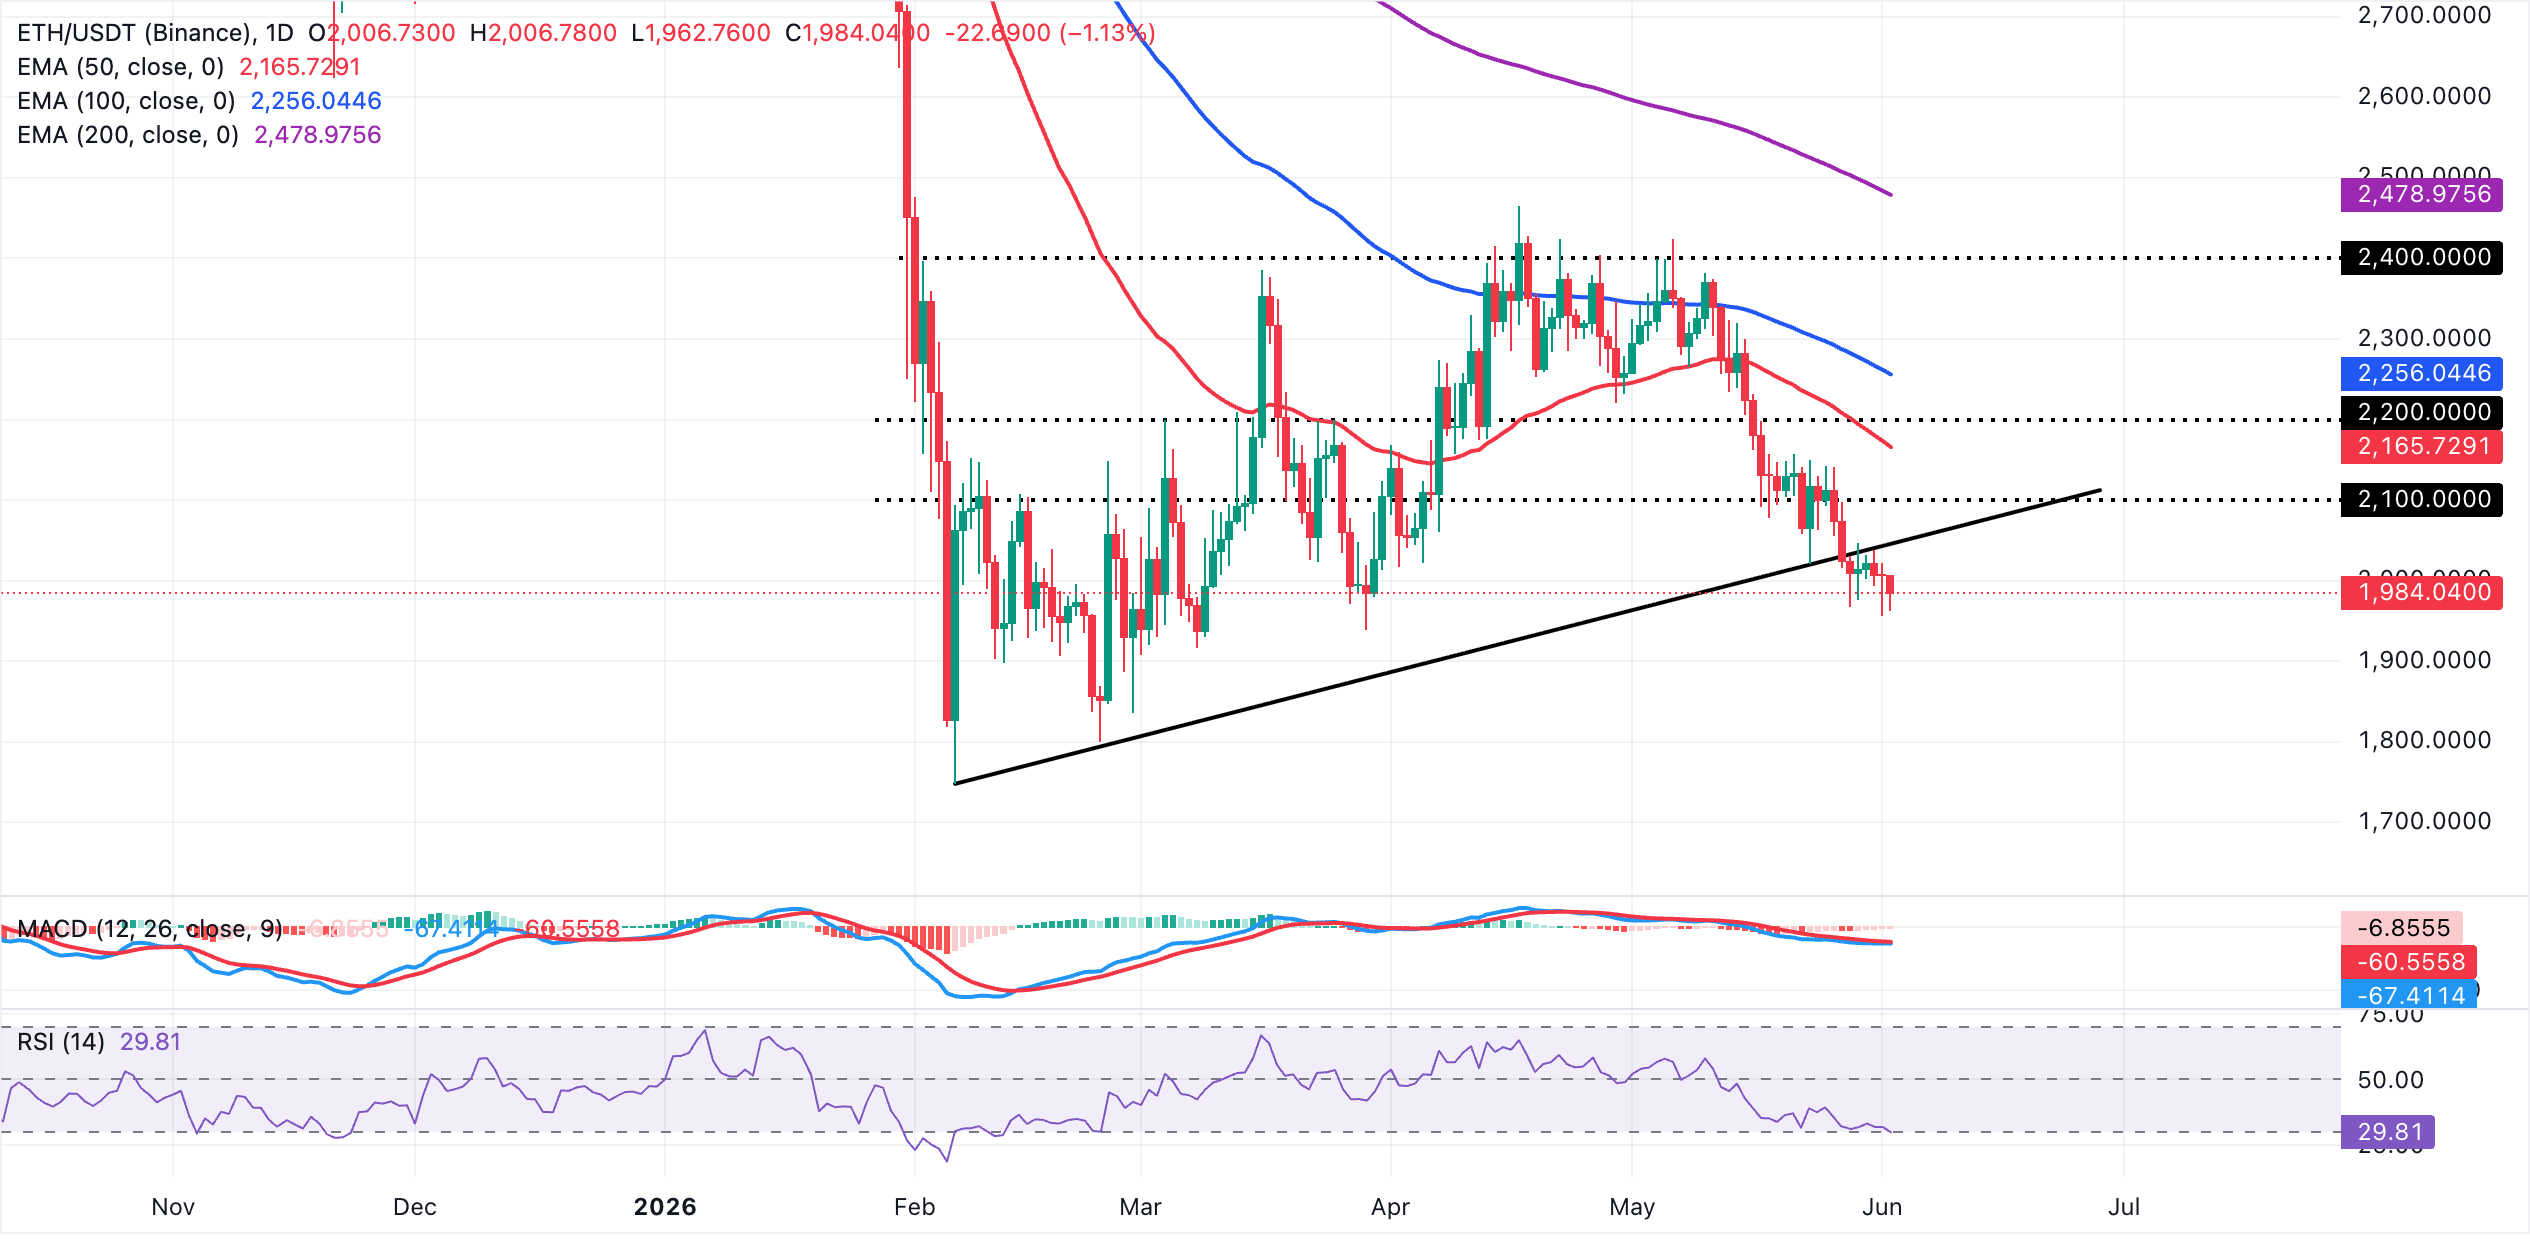
On the topside, initial resistance is seen near the rising trendline break area around $2,046, which now acts as a barrier to any recovery attempts. Above that, the 50-day EMA at $2,166 is the next obstacle, followed by the 100-day EMA at $2,256 and the 200-day EMA at $2,479, where a denser supply zone emerges. In case of an extended sell-off, buyers may seek re-entry at $1,900 and $1,800 levels, respectively.
XRP, on the other hand, trades at $1.26, extending a bearish near-term bias as price holds well beneath the 50-day, 100-day and 200-day EMAs at $1.38, $1.45 and $1.65 respectively. The stacked and declining EMAs suggest that rallies remain corrective within a broader downtrend, while the MACD indicator stays in negative territory with the line below its signal and a subdued histogram, hinting that downside momentum is still dominant despite signs of stabilization.
At the same time, RSI at 32 sits just above oversold territory on the daily chart, indicating heavy selling pressure but also that the downside could slow as conditions turn stretched.
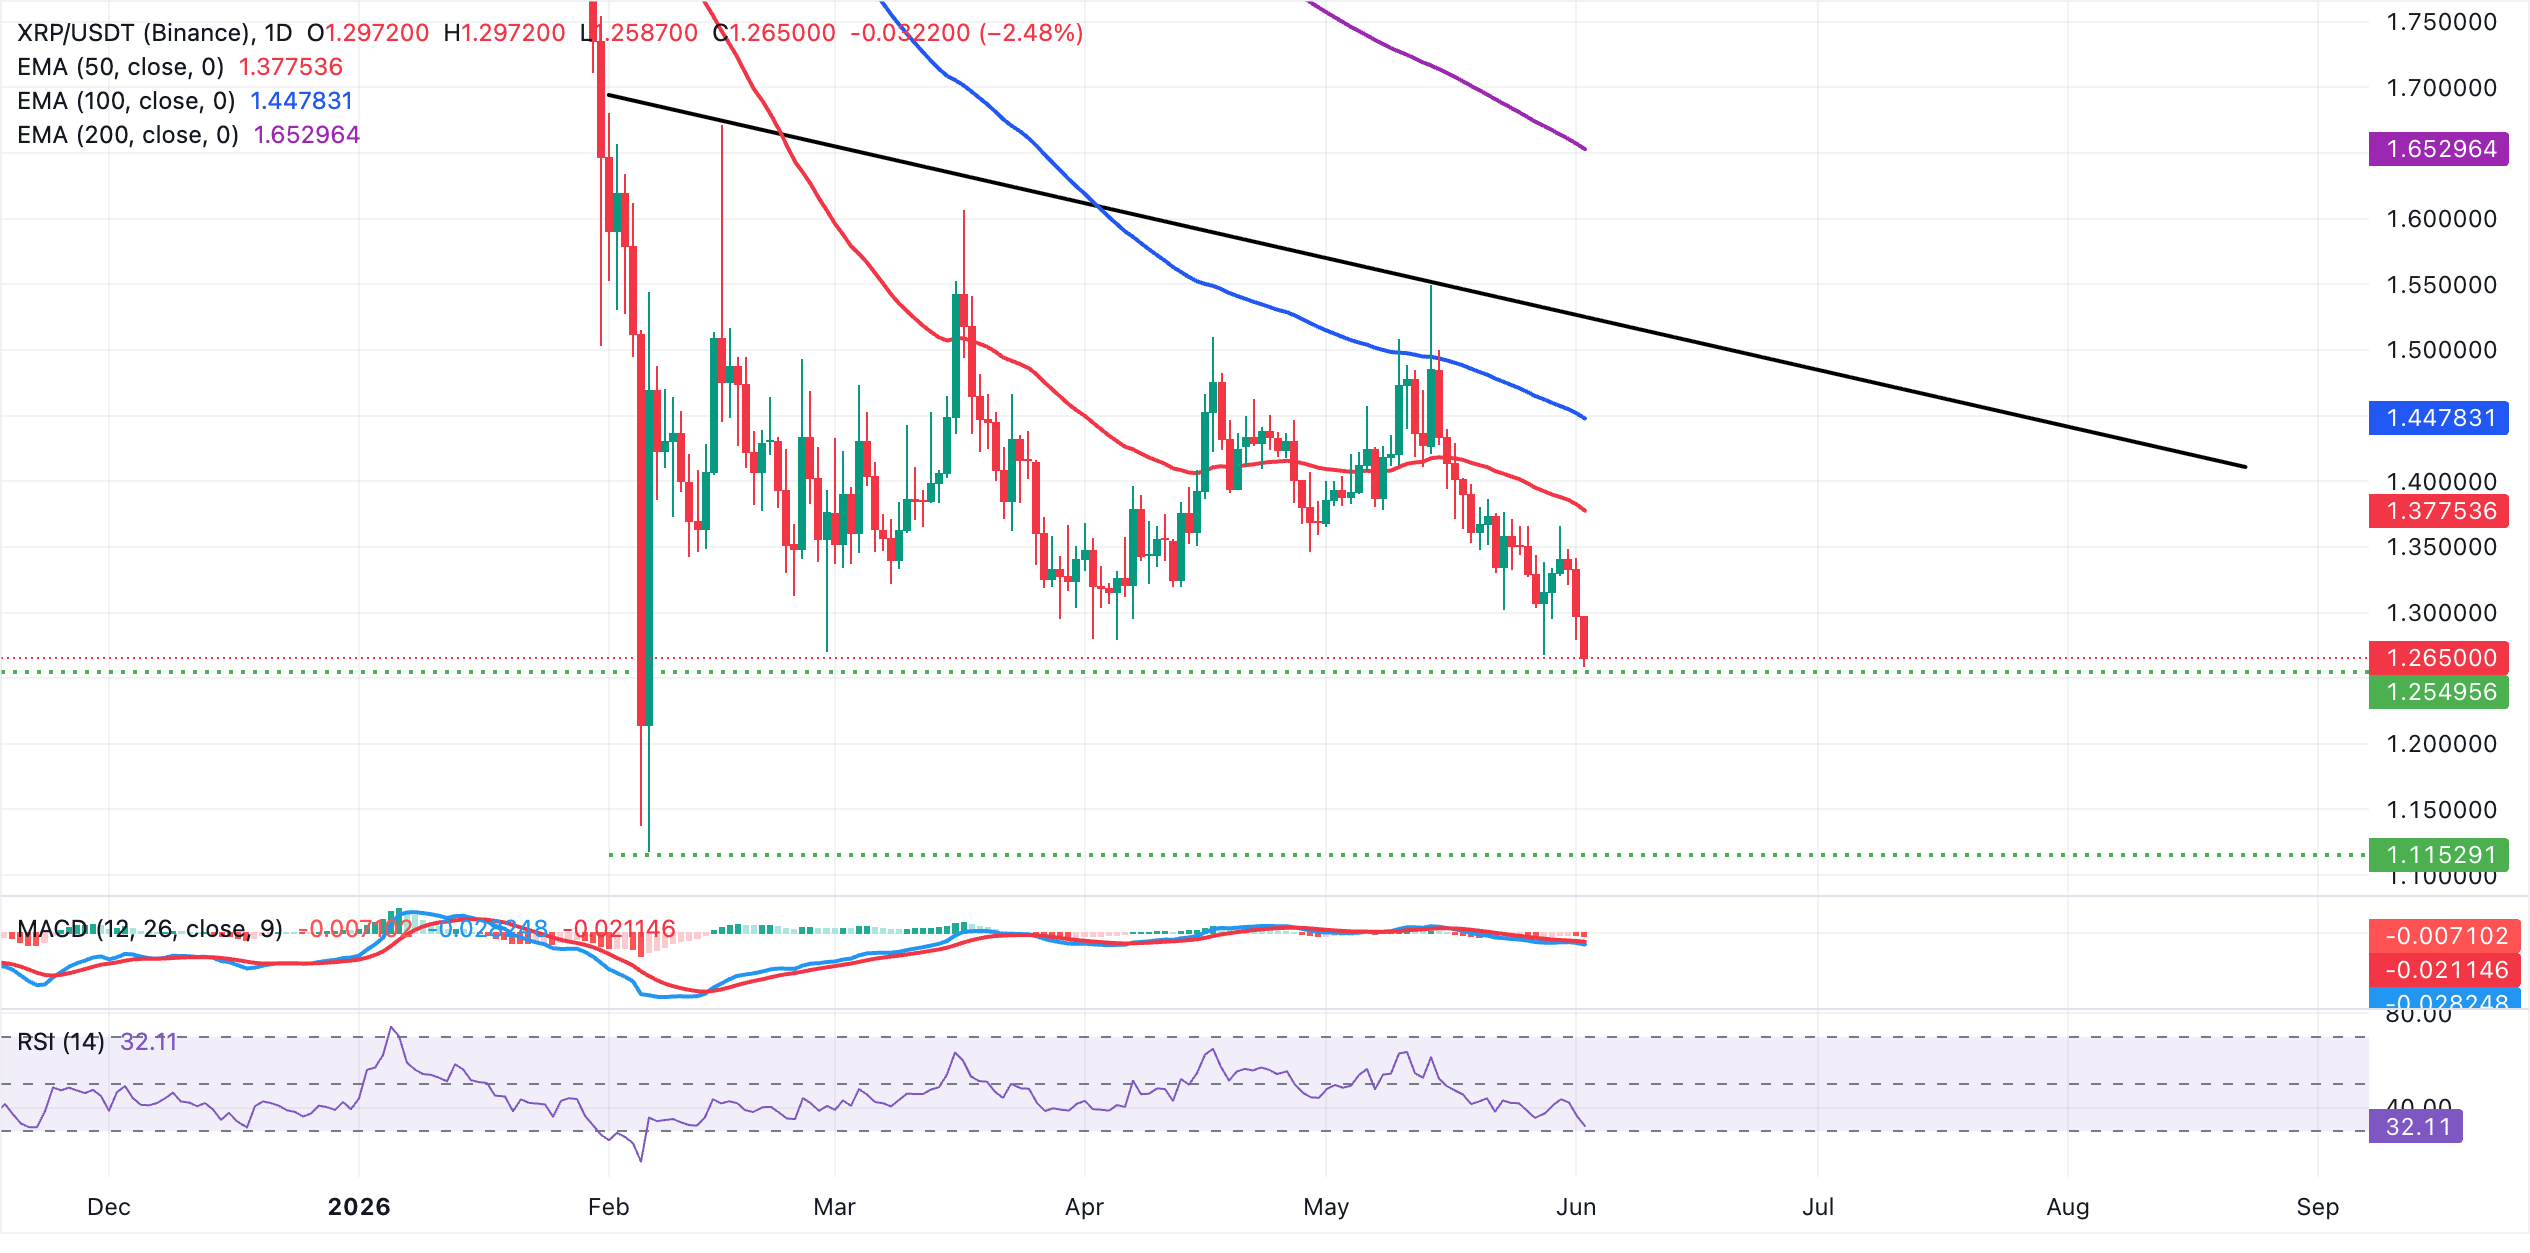
On the topside, initial resistance is seen at the 50-day EMA near $1.38, with further barriers at the 100-day EMA around $1.45 and the downtrend resistance line projected from its break area near $1.52. A sustained move above these would be needed to ease the prevailing bearish pressure. Beyond there, the 200-day EMA at $1.65 stands as a major structural cap and the key level that would have to be reclaimed to argue for a more durable bullish reversal on the daily timeframe.
(The technical analysis of this story was written with the help of an AI tool.)
Crypto ETF FAQs
An Exchange-Traded Fund (ETF) is an investment vehicle or an index that tracks the price of an underlying asset. ETFs can not only track a single asset, but a group of assets and sectors. For example, a Bitcoin ETF tracks Bitcoin’s price. ETF is a tool used by investors to gain exposure to a certain asset.
Yes. The first Bitcoin futures ETF in the US was approved by the US Securities & Exchange Commission in October 2021. A total of seven Bitcoin futures ETFs have been approved, with more than 20 still waiting for the regulator’s permission. The SEC says that the cryptocurrency industry is new and subject to manipulation, which is why it has been delaying crypto-related futures ETFs for the last few years.
Yes. The SEC approved in January 2024 the listing and trading of several Bitcoin spot Exchange-Traded Funds, opening the door to institutional capital and mainstream investors to trade the main crypto currency. The decision was hailed by the industry as a game changer.
The main advantage of crypto ETFs is the possibility of gaining exposure to a cryptocurrency without ownership, reducing the risk and cost of holding the asset. Other pros are a lower learning curve and higher security for investors since ETFs take charge of securing the underlying asset holdings. As for the main drawbacks, the main one is that as an investor you can’t have direct ownership of the asset, or, as they say in crypto, “not your keys, not your coins.” Other disadvantages are higher costs associated with holding crypto since ETFs charge fees for active management. Finally, even though investing in ETFs reduces the risk of holding an asset, price swings in the underlying cryptocurrency are likely to be reflected in the investment vehicle too.
Recommended Articles


