


XRP And XLM Correlation Sparks Hopes Of A Recovery Surge
XRP and XLM are once again drawing attention as their long-standing price correlation fuels expectations of a potential recovery rally. If history repeats itself, the recent move in XLM could signal that XRP is preparing for a bullish breakout of its own, potentially reigniting confidence across the broader XRP ecosystem.
Could XLM’s Breakout Be The Catalyst For XRP’s Next Rally?
Crypto analyst Bird highlighted a compelling structural possibility for XRP, suggesting that if it mirrors the powerful weekly candle recently delivered by XLM, a rapid ascent above the $2 threshold could be imminent. This move would serve as a vital marker, effectively invalidating the recent bearish trend and signaling a new phase of accelerated growth for the asset.
Such a breakout would do more than just shift the price; it would fundamentally transform market sentiment. By restoring confidence and generating renewed excitement, this surge would likely flood the XRP ecosystem with fresh capital, confirming that the worst of the recent corrective phase is finally behind us.
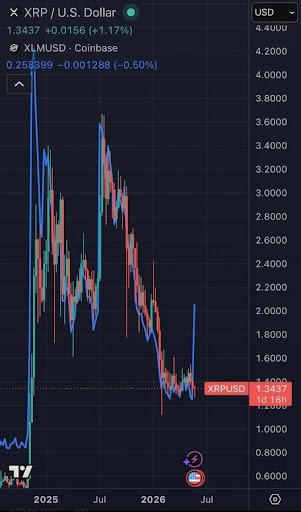
For long-term XRP holders, this momentum would act as a catalyst for heightened activity across the entire ecosystem, driving increased liquidity and participation in memes, NFTs, and Automated Market Makers (AMMs). This surge in engagement across XRP and the XRP Ledger would underscore the interconnected nature of the ledger’s economy during periods of bullish expansion.
Furthermore, the technical validity of this scenario is bolstered by the multi-year standing correlation between XRP and XLM. Time and again, these two assets have provided clues regarding each other’s future path. The question now remains: has XLM effectively fired the starting gun for XRP?
XRP/BTC Falling Wedge Signals Potential Breakout Opportunity
CryptoVision has identified the XRP/BTC chart as a pivotal focal point for the coming weeks, noting that the asset is currently developing within a well-defined falling wedge pattern. This structure remains perfectly intact, suggesting that significant accumulation is occurring beneath the surface. For market participants, this chart provides a clear technical roadmap, indicating that the current consolidation phase is a critical precursor to a potential shift in market dominance.
If XRP can successfully consolidate and harness momentum from these current levels, a retest of the upper resistance boundary is anticipated in the near term. This test will serve as the definitive moment for bulls to assert control and confirm the validity of the wedge.
Once the price decisively clears this wedge formation, the market dynamic is expected to shift rapidly. The analyst suggests that this pattern will signal a strong and rapid upward move, potentially triggering a significant shift in the pair’s trend in the long term.
Recommended Articles


