


Pi Network Price Forecast: PI steadies, defying the broader market collapse
- Pi Network holds steady above $0.1400 on Thursday, defying the broader pullback in the crypto market.
- Mild improvement in retail interest as PI consolidates implies that selling pressure is easing.
- The technical outlook remains bearish, with PI consolidating within a declining channel pattern.
Pi Network (PI) trades above $0.1400 at press time on Thursday, holding steady as the broader crypto market collapses. The mild improvement in retail interest, which coincides with the announcement of the Stellar Protocol 24 mainnet upgrade deadline, is likely capping the downside move. Still, the technical outlook remains bearish, with PI risking a drop from the cliff’s edge at $0.1410.
Social chatter and spot price divergence
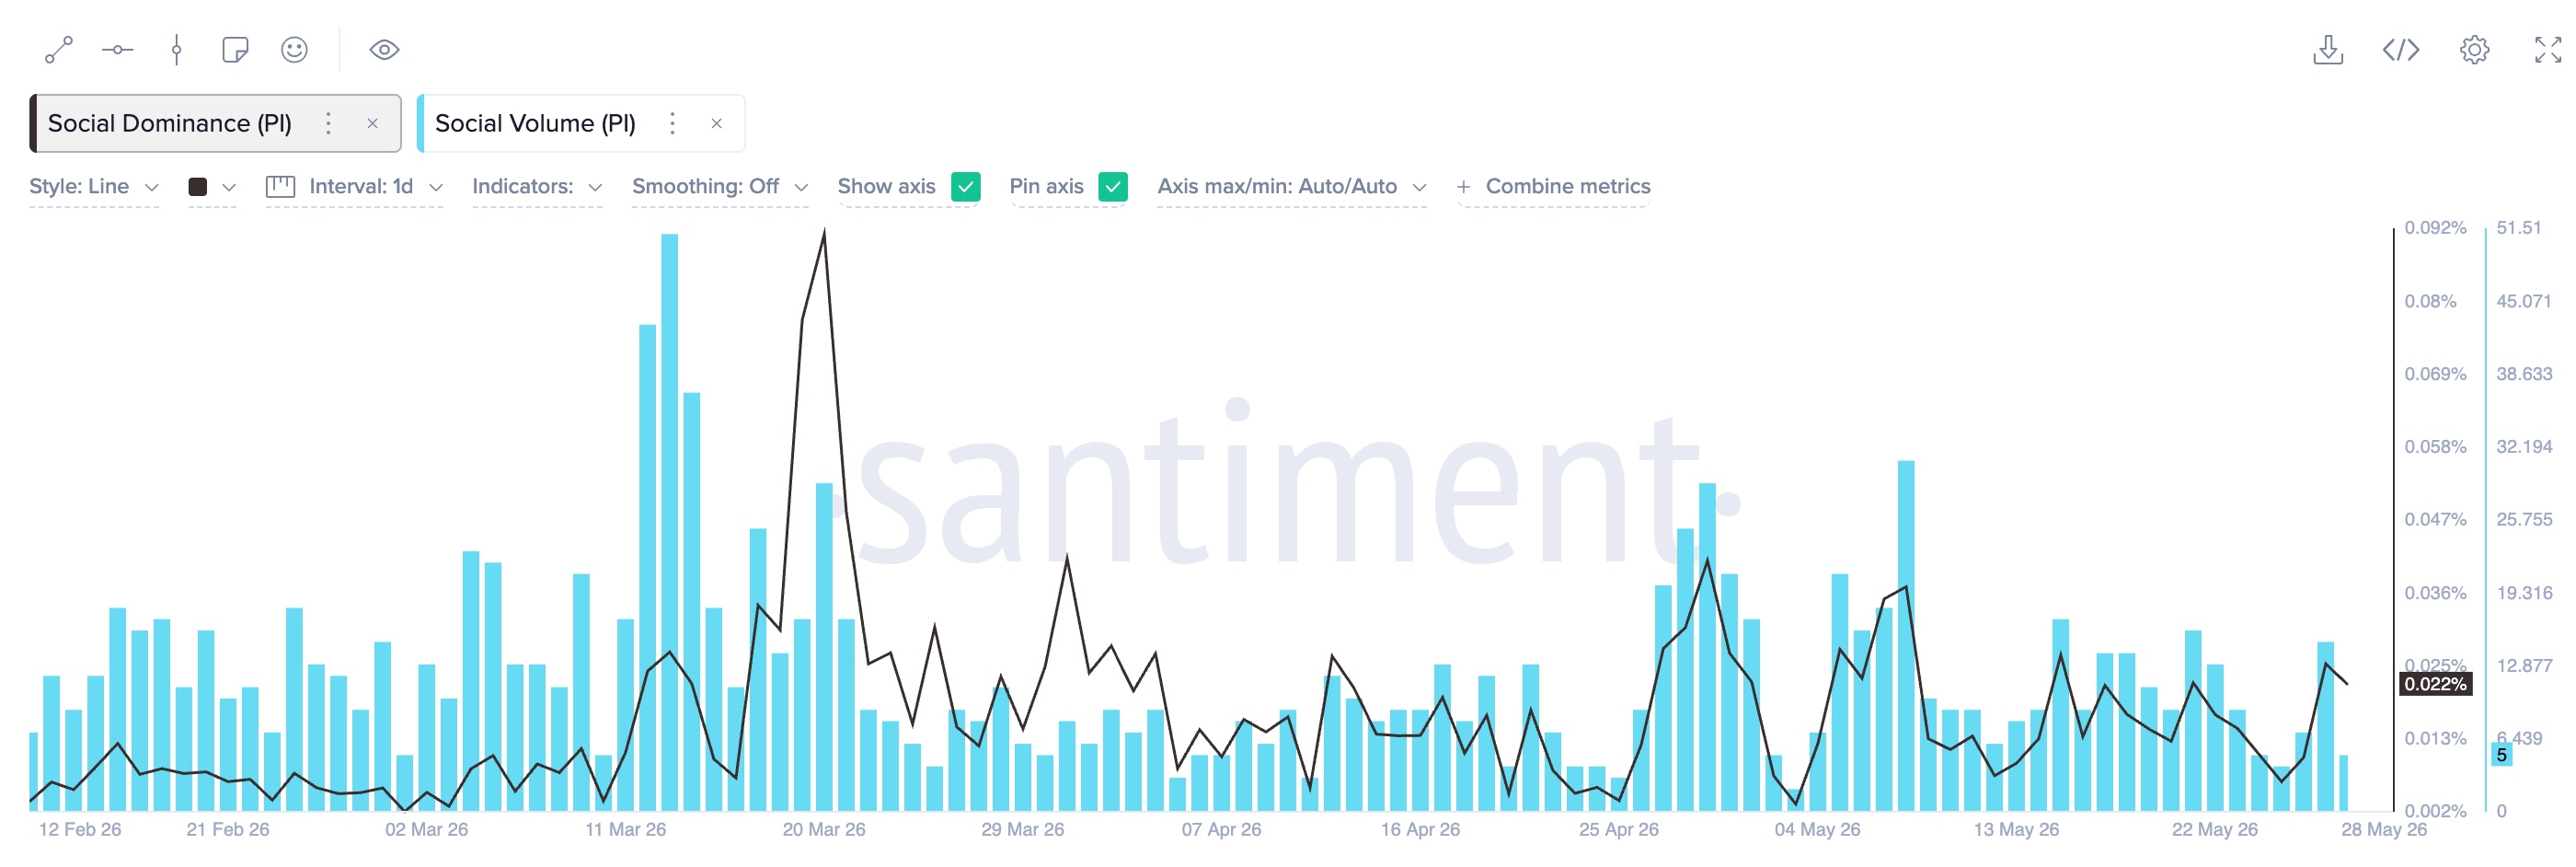
The Pi Core Team announced June 2 as the deadline for the Stellar Protocol version 24 mainnet upgrade, as previously reported by FXStreet. This announcement triggered a mild uptick in social chatter surrounding Pi Network, which typically stabilizes the spot price, as the PI token is broadly a speculative asset.
Santiment data shows the social dominance of PI surged to 0.024% on Wednesday, up from 0.010% the previous day. However, the price remains flat despite the blip in social noise, suggesting that although selling pressure is easing in the short term, downside risk persists.
Technical outlook: Will Pi Network break below $0.1400?
Pi Network maintains a bearish near-term tone as it consolidates between two declining trendlines on the 4-hour chart, with break levels at $0.1457 and $0.1382, forming a falling channel pattern. The PI token remains capped by the 50-, 100-, and 200-period Exponential Moving Averages (EMAs) near $0.1491, $0.1548, and $0.1612, respectively, reinforcing the broader downside structure.
The Relative Strength Index (RSI) has risen to 41 from oversold earlier this week on the 4-hour chart, hinting at subdued buying interest. Meanwhile, the Moving Average Convergence Divergence (MACD) sits only marginally above its signal line, suggesting a weak bullish crossover as upside momentum remains fragile against prevailing overhead supply.
The immediate support for PI coincides with Tuesday's low of $0.1412, near the S2 Pivot Point at $0.1410. A break below this zone would open the path toward the lower declining trendline at $0.1382.
On the upside, the upper trendline at $0.1457, close to the broken support level of $0.1463, could extend the recovery toward the 50-period EMA at $0.1491.
(The technical analysis of this story was written with the help of an AI tool.)
Bitcoin, altcoins, stablecoins FAQs
Bitcoin is the largest cryptocurrency by market capitalization, a virtual currency designed to serve as money. This form of payment cannot be controlled by any one person, group, or entity, which eliminates the need for third-party participation during financial transactions.
Altcoins are any cryptocurrency apart from Bitcoin, but some also regard Ethereum as a non-altcoin because it is from these two cryptocurrencies that forking happens. If this is true, then Litecoin is the first altcoin, forked from the Bitcoin protocol and, therefore, an “improved” version of it.
Stablecoins are cryptocurrencies designed to have a stable price, with their value backed by a reserve of the asset it represents. To achieve this, the value of any one stablecoin is pegged to a commodity or financial instrument, such as the US Dollar (USD), with its supply regulated by an algorithm or demand. The main goal of stablecoins is to provide an on/off-ramp for investors willing to trade and invest in cryptocurrencies. Stablecoins also allow investors to store value since cryptocurrencies, in general, are subject to volatility.
Bitcoin dominance is the ratio of Bitcoin's market capitalization to the total market capitalization of all cryptocurrencies combined. It provides a clear picture of Bitcoin’s interest among investors. A high BTC dominance typically happens before and during a bull run, in which investors resort to investing in relatively stable and high market capitalization cryptocurrency like Bitcoin. A drop in BTC dominance usually means that investors are moving their capital and/or profits to altcoins in a quest for higher returns, which usually triggers an explosion of altcoin rallies.
Recommended Articles


