

XRP Price Slides Sharply Lower As Selling Pressure Intensifies Rapidly

Source Newsbtc

XRP price extended losses and traded below $1.30. The price is now consolidating losses and faces hurdles near $1.30 and $1.340.

  • XRP price started another decline and traded below the $1.30 zone.
  • The price is now trading below $1.30 and the 100-hourly Simple Moving Average.
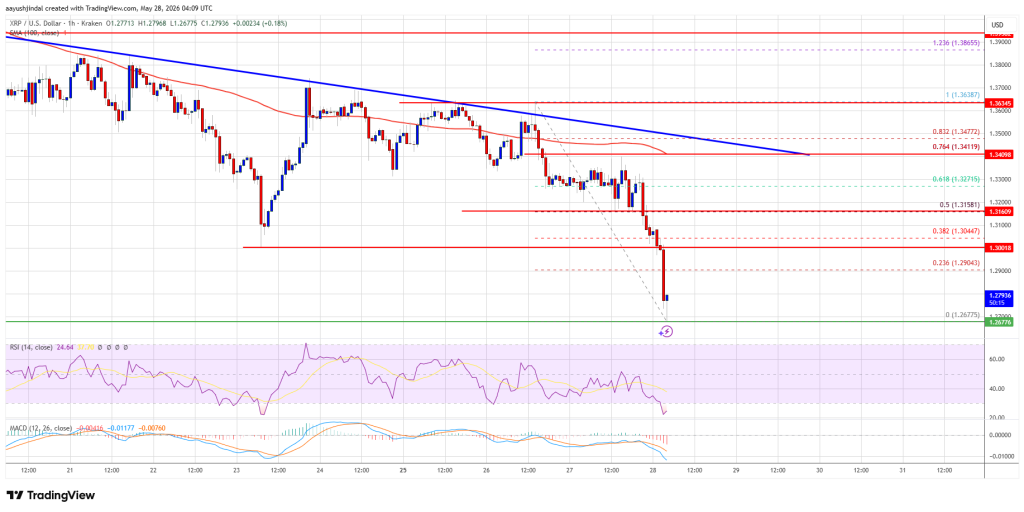
  • There is a bearish trend line forming with resistance at $1.340 on the hourly chart of the XRP/USD pair (data source from Kraken).
  • The pair could continue to move down if it stays below $1.340.

XRP Price Dips Below $1.30

XRP price failed to stay above $1.340 and extended its decline, like Bitcoin and Ethereum. The price declined below $1.3250 and $1.3120 to enter a short-term bearish zone.

The price even extended losses below $1.30. A low was formed at $1.2677, and the price is now consolidating losses well below the 23.6% Fib retracement level of the downward move from the $1.3638 swing high to the $1.2677 low.

The price is now trading below $1.30 and the 100-hourly Simple Moving Average. If there is a fresh recovery move, the price might face resistance near the $1.290 level. The first major resistance is near the $1.30 level. The main resistance could be $1.3150 or the 50% Fib retracement level of the downward move from the $1.3638 swing high to the $1.2677 low.
XRP Price

A close above $1.3150 could send the price to $1.3275. The next hurdle sits at $1.340. There is also a bearish trend line forming with resistance at $1.340 on the hourly chart of the XRP/USD pair. A clear move above the $1.340 resistance might send the price toward the $1.3550 resistance. Any more gains might send the price toward the $1.3750 resistance.

More Losses?

If XRP fails to clear the $1.3150 resistance zone, it could start a fresh decline. Initial support on the downside is near the $1.2675 level. The next major support is near the $1.2550 level.

If there is a downside break and a close below the $1.2550 level, the price might continue to decline toward $1.2320. The next major support sits near the $1.220 zone, below which the price could continue lower toward $1.20.

Technical Indicators

Hourly MACD – The MACD for XRP/USD is now gaining pace in the bearish zone.

Hourly RSI (Relative Strength Index) – The RSI for XRP/USD is now below the 50 level.

Major Support Levels – $1.2675 and $1.2550.

Major Resistance Levels – $1.3150 and $1.3400.

Disclaimer: For information purposes only. Past performance is not indicative of future results.
placeholder
Markets in 2026: Will gold, Bitcoin, and the U.S. dollar make history again? — These are how leading institutions thinkAfter a turbulent 2025, what lies ahead for commodities, forex, and cryptocurrency markets in 2026?
Author  Insights
Dec 25, 2025
After a turbulent 2025, what lies ahead for commodities, forex, and cryptocurrency markets in 2026?
placeholder
ECB Policy Outlook for 2026: What It Could Mean for the Euro’s Next MoveWith the ECB likely holding rates steady at 2.15% and the Fed potentially extending cuts into 2026, EUR/USD may test 1.20 if Eurozone growth proves resilient, but weaker growth and an ECB pivot could pull the pair back toward 1.13 and potentially 1.10.
Author  Mitrade
Dec 26, 2025
With the ECB likely holding rates steady at 2.15% and the Fed potentially extending cuts into 2026, EUR/USD may test 1.20 if Eurozone growth proves resilient, but weaker growth and an ECB pivot could pull the pair back toward 1.13 and potentially 1.10.
placeholder
My Top 5 Stock Market Predictions for 2026Five 2026 market predictions written in a native, news-style voice: AI’s winners and losers, broader sector leadership, dividend demand, valuation cooling as the Shiller CAPE sits at 39 (Dec. 31, 2025), and quantum-computing bursts—while keeping all original facts and numbers unchanged.
Author  Mitrade
Jan 06, Tue
Five 2026 market predictions written in a native, news-style voice: AI’s winners and losers, broader sector leadership, dividend demand, valuation cooling as the Shiller CAPE sits at 39 (Dec. 31, 2025), and quantum-computing bursts—while keeping all original facts and numbers unchanged.
placeholder
Gold Price Forecast: XAU/USD keeps looking for direction above $4,500Gold (XAU/USD) trades lower for the second consecutive day on Friday, but remains contained within previous ranges, with downside attempts limited above the $4,500 line for now.
Author  FXStreet
May 22, Fri
Gold (XAU/USD) trades lower for the second consecutive day on Friday, but remains contained within previous ranges, with downside attempts limited above the $4,500 line for now.
placeholder
Gold declines to near $4,500 as renewed US‑Iran tensions, Fed tightening bets weighGold price (XAU/USD) loses ground to around $4,500 during the early Asian session on Wednesday. The precious metal extends the decline as fresh US military strikes on Iran dimmed hopes of a peace deal and reinforced concerns that persistent inflation could keep interest rates higher for longer. 
Author  FXStreet
Yesterday 01: 26
Gold price (XAU/USD) loses ground to around $4,500 during the early Asian session on Wednesday. The precious metal extends the decline as fresh US military strikes on Iran dimmed hopes of a peace deal and reinforced concerns that persistent inflation could keep interest rates higher for longer. 
goTop
quote