

Arbitrum price prediction 2026 – 2032: Will ARB reach $1?
Key takeaways:
- Our ARB predictions anticipate a high of $0.31 in 2026.
- In 2028, the range is expected to be between $0.61 and $0.74, with an average price of $0.63.
- In 2030, it will range between $1.24 and $1.52, with an average price of $1.28.
Layer 2s have generated considerable buzz for their efficiency. Arbitrum network is in the top 5 pack, with a total value locked (TVL) of $1.60 billion. Arbitrum is an Optimistic Rollup solution that shifts network operations away from the Ethereum mainnet while maintaining Ethereum-level security.
Is Arbitrum a good investment? Will it go up? Where will it be in 5 years? Let’s answer these questions and more in our Arbitrum price prediction.
Overview
| Cryptocurrency | Arbitrum |
| Ticker | ARB |
| Current Arbitrum price | $0.1265 |
| Market cap | $788.11M |
| Trading volume | $135.43M |
| Circulating supply | 6.15B |
| All-time high | $2.40 on Jan 12, 2024 |
| All-time low | $0.08653 on Mar 30, 2026 |
| 24-hour high | $0.13 |
| 24-hour low | $0.12 |
Arbitrum price prediction: Technical analysis
| Metric | Value |
| Volatility (30-day variation) | 30.78% (Extremely High) |
| 50-day SMA | $3.46 |
| 200-day SMA | $3.78 |
| Sentiment | Bullish |
| Green days | 16/30 (53%) |
| Fear and Greed Index | 46 (Fear) |
Arbitrum price analysis
On May 7, Arbitrum’s price surged 4.67% in 24 hours and 34.18% over the last 30 days. The surge was accompanied by high trading volumes (76.30%).
ARB 1-day chart analysis
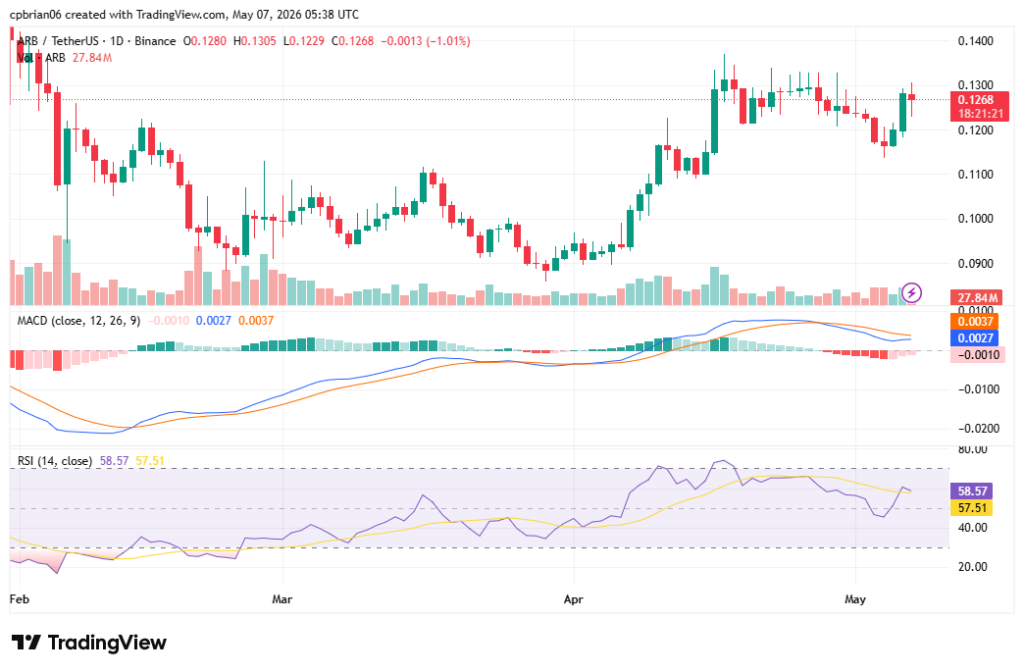
ARB has consistently traded higher since April. The recovery tracked the broader altcoin rally, driven by capital rotation into the sector — reflected in a rising Altcoin Season Index and strong gains in tokens such as NEAR and TON.
On the charts, ARB faces resistance at $0.13. A break below $0.1229 could trigger a pullback, considering the upcoming ARB token unlock.
Arbitrum price 4-hour chart price analysis
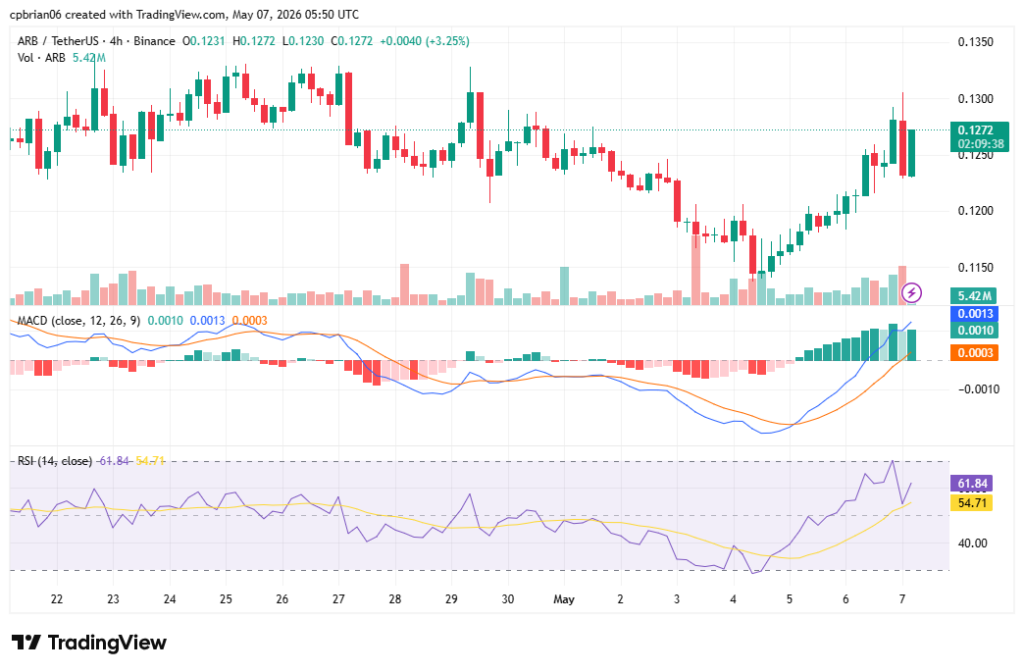
ARB registered a new all-time low (ATL) of $0.087 in March. The coin recovered in April following a reversal from the drop fueled by a recovering altcoin market. The chart highlights ARB’s run over the last two days before facing resistance. With its RSI at 61.84, the chart suggests there’s still room for further upside.
Arbitrum technical indicators: Levels and action
Daily simple moving average (SMA)
| Period | Value ($) | Action |
| SMA 3 | 5.21 | BUY |
| SMA 5 | 5.13 | BUY |
| SMA 10 | 4.78 | BUY |
| SMA 21 | 4.94 | BUY |
| SMA 50 | 3.46 | BUY |
| SMA 100 | 3.11 | BUY |
| SMA 200 | 3.78 | BUY |
Daily exponential moving average (EMA)
| Period | Value ($) | Action |
| EMA 3 | 5.16 | BUY |
| EMA 5 | 5.08 | BUY |
| EMA 10 | 4.91 | BUY |
| EMA 21 | 4.56 | BUY |
| EMA 50 | 3.88 | BUY |
| EMA 100 | 3.67 | BUY |
| EMA 200 | 4.24 | BUY |
What to expect from the ARB price analysis next?
ARB still has upside potential; however, a scheduled unlock of 11.58M ARB tokens in 8 days may introduce selling pressure.
Why is Arbitrum up?
Capital rotation into the altcoin sector, evidenced by a rising Altcoin Season Index and strong concurrent gains in tokens like NEAR and TON.
Does Arbitrum have a future?
A high adoption rate is crucial for any blockchain’s long-term success and sustainability. Arbitrum’s performance in this regard is a positive sign of its future performance despite the price declines.
Recent news
A key governance vote reached quorum, with over 1,600 addresses approving the release of
30,766 ETH (worth ~$71M) recovered from an April exploit back to Aave for user restitution. The successful vote reduced ecosystem risk and reinforced Arbitrum’s utility in complex DeFi resolutions.
ARB price prediction May 2026
The Arbitrum price forecast for May ranges from a minimum of $0.0950 to a maximum of $0.1501. The average price for the month will be $0.1209.
| Month | Potential low ($) | Potential average ($) | Potential high ($) |
| May | 0.0950 | 0.1209 | 0.1501 |
Arbitrum price prediction 2026
For 2026, ARB’s price will range between $0.08 and $0.31. The average price for the period will be $0.21.
| Year | Potential low ($) | Potential average ($) | Potential high ($) |
| 2026 | 0.0808 | 0.2122 | 0.3109 |
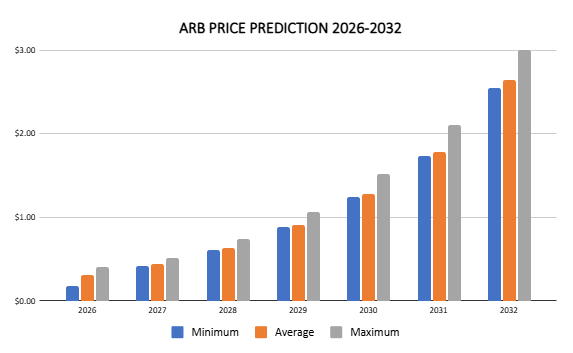
Arbitrum price prediction 2027-2032
| Year | Potential low ($) | Potential average ($) | Potential high ($) |
| 2027 | 0.4207 | 0.4364 | 0.5134 |
| 2028 | 0.6123 | 0.6341 | 0.7447 |
| 2029 | 0.8807 | 0.9124 | 1.06 |
| 2030 | 1.24 | 1.28 | 1.52 |
| 2031 | 1.73 | 1.78 | 2.10 |
| 2032 | 2.55 | 2.64 | 3.00 |
Arbitrum price prediction 2027
Arbitrum market price prediction climbs even higher into 2027. According to the prediction, ARB’s price will range from $0.42 to $0.51, with an average of $0.44.
Arbitrum coin price prediction 2028
Our analysis indicates a further acceleration in ARB’s price. It will trade between $0.61 and $0.74 and an average price of $0.63.
Arbitrum price prediction 2029
According to the 2029 Arbitrum forecast, the price of ARB will range from $0.88 to $1.06, with an average of $0.91.
ARB price prediction 2030
The ARB price prediction for 2030 is $1.24-$1.52, with an average of $1.28.
Arbitrum price prediction 2031
The Arbitrum price forecast for 2031 is a high of $2.10. It will reach a minimum price of $1.73 and an average price of $1.78.
Arbitrum ARB price prediction 2032
The year 2032 will also be bullish. Our analysis estimates a price range of $2.55 to $3.00, with an average price of $2.64.
ARB market price prediction: Analysts’ ARB price forecast
| Platform | 2026 | 2027 | 2028 |
| Coincodex | $0.09635 | $0.2156 | $0.1447 |
| Gate.com | $0.1234 | $0.1517 | $0.1237 |
Cryptopolitan’s ARB price prediction
Our predictions indicate that ARB will reach a high of $0.31 in 2026. In 2028, the range is expected to be between $0.61 and $0.74, with an average of $0.63. In 2030, the range is likely to be between $1.24 and $1.52, with an average of $1.28. Note that the predictions are not investment advice. Seek independent professional consultation or do your research.
Arbitrum historic price sentiment
- The Arbitrum airdrop snapshot occurred on Feb 6, 2023, and eligible participants started claiming on Mar 23, 2023. The claiming period ended on Sep 24, 2023.
- The airdrop granted 11.5% of the total supply to eligible users, 1.1% to DAOs operating in the Arbitrum ecosystem, and 44% to employees and Offchain Labs investors. The 44% is subject to lock-up periods and a vesting schedule. The rest was sent to the Arbitrum DAO treasury.
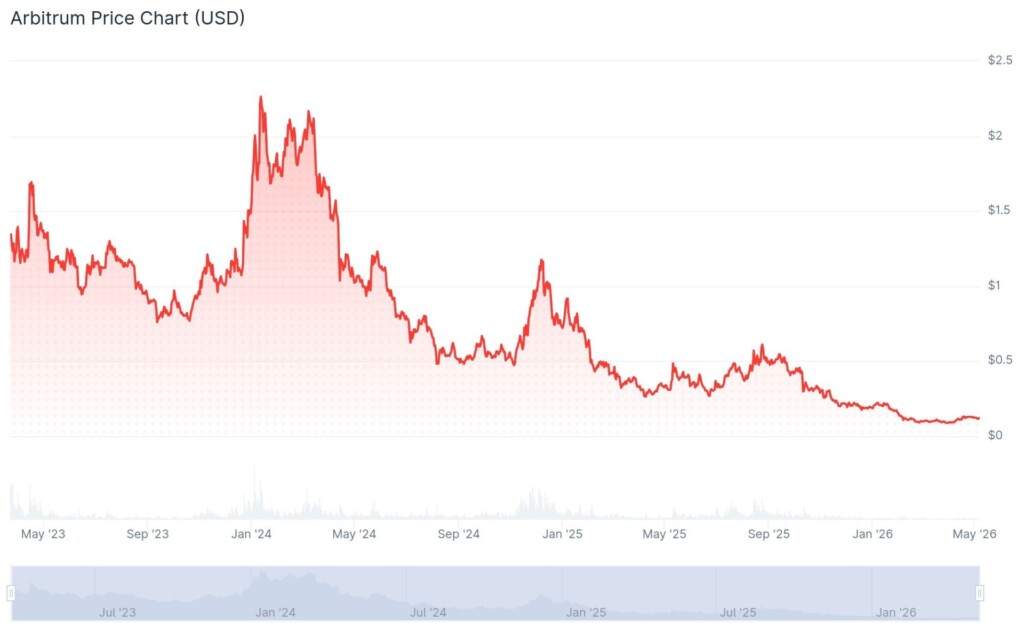
- On Sep 11, 2023, it fell to its all-time low at $0.7453.
- Bitcoin’s halving and the hype around crypto ETFs helped the coin recover from its October slump. By the end of the year, it had risen to $1.4.
- The run continued into 2024. On Jan 12, it reached its all-time high at $2.40.
- Per CoinMarketCap data, ARB broke below its listing price in June 2024.
- On August 5, 2024, it registered a new all-time low of $0.4317
- It then recovered in September, reaching a high of $0.67.
- The bullish run continued into November, reaching $1.12 in December.
- The coin crossed into 2025, trading at $0.72 when it assumed a bear run, falling to a low of $0.40 in February.
- It recovered later and crossed into October, trading at $0.45. The trend later reversed, and by date 11, it had fallen to $0.136.
- In December, it traded at $0.20.
- ARB then entered a bear market in 2026, and on Mar 30, 2026, it hit an all-time low of $0.08653.
- It later started recovering, and by May, it had crossed above $0.12.
Recommended Articles


