

Why The PEPE Price Could Stage A 55X Rally To Reach New $0.0001 ATH

Source Newsbtc

The PEPE price has now started to edge back into bullish conversations after the recent inflows into the crypto market. The last time PEPE’s weekly chart printed the kind of structure now forming on its chart, its price action delivered one of the most violent vertical rallies in crypto history. That was in 2023. Crypto analyst Crypto Patel is now arguing, with charts in hand, that the fractal-level structure has reloaded and that this cycle’s rally could be even bigger.

A PEPE Fractal Built On Rare Confluence

At the time of writing, PEPE is trading around $0.0000038, which leaves it about 87% below its all-time high of $0.00002803, yet still large enough to carry a market capitalization of $1.59 billion. However, technical analysis shows that this decline might end soon, and a 55x rally is possible for XRP. 

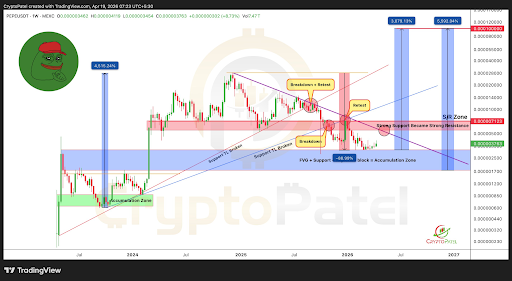
The backbone of this prediction is the convergence of three technical structures on the weekly timeframe at the same price level: a Fair Value Gap, an Order Block, and a horizontal support zone that has been holding for the past few months. This kind of triple confluence at a single demand area is unusual at any timeframe, and on the weekly chart, it carries the weight of months of price history.

Back in 2023, PEPE entered an almost identical FVG-plus-Order-Block confluence after a prolonged breakdown and retest sequence, then launched into a 4,515% move. Crypto Patel’s projection maps the current structure as a direct mirror of that setup with the same breakdown, the same retest, and the same demand reclaim and assigns a 5,592% expansion target for this cycle.
PEPE Price

PEPE Price Chart. Source: @CryptoPatel On X

The intermediate targets along the way are at its current peak of $0.000028 and then $0.00005, which are consistent with the Fibonacci extensions typically seen in memecoin cycle expansions. The final target is a possible move to $0.0001 sometime during the end of the bull cycle, which would be a new all-time high by a substantial margin.

What Needs To Happen For A PEPE Rally?

PEPE is currently trading at $0.0000038, positioned right above an Accumulation Zone between the $0.0000030 and $0.0000018 demand blocks. The first major ceiling that PEPE must reclaim is an S/R flip zone around $0.0000071. This was a strong support level that flipped into resistance following a breakdown in Q3 2026. 

A close and hold above $0.000006, according to the analyst, would be the structural confirmation that the super bullish expansion has begun. Interestingly, the analyst highlighted $0.0000017 as the invalidation level, which means the bullish idea only stays alive if the lower end of that weekly support continues to hold.

Recent market commentary has also pointed to improving short-term behavior for PEPE, with one analysis pointing out different bullish developments that point to a brewing rally. 

PEPE price chart from Tradingview.com
Disclaimer: For information purposes only. Past performance is not indicative of future results.
placeholder
ECB Policy Outlook for 2026: What It Could Mean for the Euro’s Next MoveWith the ECB likely holding rates steady at 2.15% and the Fed potentially extending cuts into 2026, EUR/USD may test 1.20 if Eurozone growth proves resilient, but weaker growth and an ECB pivot could pull the pair back toward 1.13 and potentially 1.10.
Author  Mitrade
Dec 26, 2025
With the ECB likely holding rates steady at 2.15% and the Fed potentially extending cuts into 2026, EUR/USD may test 1.20 if Eurozone growth proves resilient, but weaker growth and an ECB pivot could pull the pair back toward 1.13 and potentially 1.10.
placeholder
My Top 5 Stock Market Predictions for 2026Five 2026 market predictions written in a native, news-style voice: AI’s winners and losers, broader sector leadership, dividend demand, valuation cooling as the Shiller CAPE sits at 39 (Dec. 31, 2025), and quantum-computing bursts—while keeping all original facts and numbers unchanged.
Author  Mitrade
Jan 06, Tue
Five 2026 market predictions written in a native, news-style voice: AI’s winners and losers, broader sector leadership, dividend demand, valuation cooling as the Shiller CAPE sits at 39 (Dec. 31, 2025), and quantum-computing bursts—while keeping all original facts and numbers unchanged.
placeholder
Financial Markets 2026: Volatility Catalysts in Gold, Silver, Oil, and Blue-Chip Stocks—A CFD Trader's OutlookGet a comprehensive financial market 2026 outlook exploring key economic drivers, volatility catalysts in gold, oil and stocks, and what the evolving economic outlook means for cfd trading strategies and risk management on global markets.
Author  Rachel Weiss
20 hours ago
Get a comprehensive financial market 2026 outlook exploring key economic drivers, volatility catalysts in gold, oil and stocks, and what the evolving economic outlook means for cfd trading strategies and risk management on global markets.
placeholder
Bitcoin Weekly Forecast: Is the month-long rally over?Bitcoin (BTC) edges slightly lower so far this week, trading at $80,800 on Friday after being rejected around the key overhead supply zone. Institutional investors also show cautious signs, with BTC spot Exchange Traded Funds (ETFs) recording an outflow of over $709 million through Thursday.
Author  Bitcoinist
21 hours ago
Bitcoin (BTC) edges slightly lower so far this week, trading at $80,800 on Friday after being rejected around the key overhead supply zone. Institutional investors also show cautious signs, with BTC spot Exchange Traded Funds (ETFs) recording an outflow of over $709 million through Thursday.
placeholder
Financial Markets 2026: Volatility Catalysts in Gold, Silver, Oil, and Blue-Chip Stocks—A CFD Trader's OutlookGet a comprehensive financial market 2026 outlook exploring key economic drivers, volatility catalysts in gold, oil and stocks, and what the evolving economic outlook means for cfd trading strategies and risk management on global markets.
Author  Rachel Weiss
20 hours ago
Get a comprehensive financial market 2026 outlook exploring key economic drivers, volatility catalysts in gold, oil and stocks, and what the evolving economic outlook means for cfd trading strategies and risk management on global markets.
goTop
quote