

Bitcoin Price Forecast: BTC slips below $67,000 as ETF outflows, Trump war comments curb risk appetite
- Bitcoin price extends its losses on Thursday, nearly erasing the recovery earlier this week.
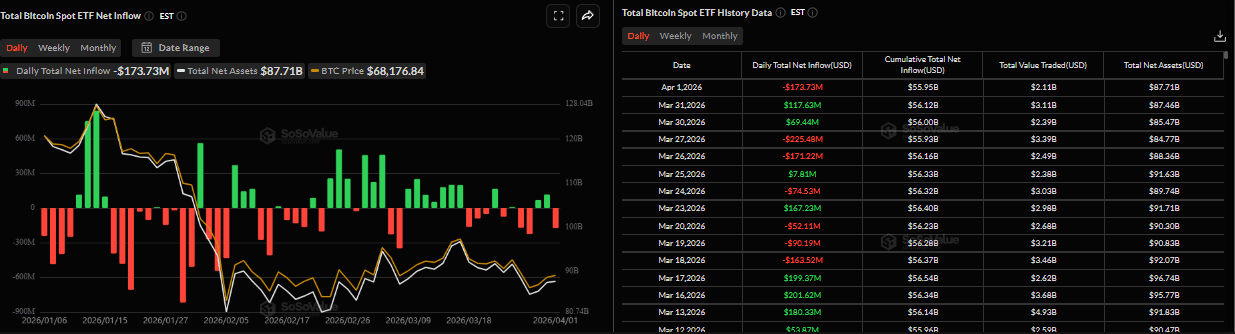
- US-listed spot ETF recorded an outflow of $173.73 million on Wednesday, breaking its two days of inflow this week.
- Risk appetite deteriorates after Trump signaled the war could drag on and escalate, weighing on BTC price.
Bitcoin (BTC) price extends losses, trading below $67,000 at the time of writing on Thursday, nearly wiping out its early-week recovery. Along with this, institutional demand weakens as spot Exchange Traded Funds (ETFs) recorded an outflow of over $173 million on Wednesday, breaking two consecutive days of inflows. While the bearish sentiment strengthens, US President Donald Trump signaled the war could drag on and escalate, further weighing on the Crypto King.
Trump’s remarks dampen risk appetite
Addressing the nation on Wednesday, President Trump threatened that the ongoing war would continue until late April, stating that "We are going to hit them extremely hard over the next two to three weeks," threatened to strike Iranian power plants, and said Iran would be sent back to the “stone age” if no deal is reached.
These developments temper hopes for de-escalation in Iran and investors’ appetite for riskier assets, bolstering the US Dollar (USD) and Oil prices while weighing on US equities and other risky assets, erasing the recovery seen earlier this week.
Institutional investors remain muted
Institutional demand for Bitcoin shows mixed sentiment so far this week. SoSoValue data showed that spot Bitcoin ETFs recorded an outflow of $173.73 million on Wednesday after two days of positive flows earlier this week. This highlights indecisiveness among institutional investors, who are not willing to increase exposure toward risk assets amid prevailing market uncertainty.
BTC is locked in a broader sideways trend
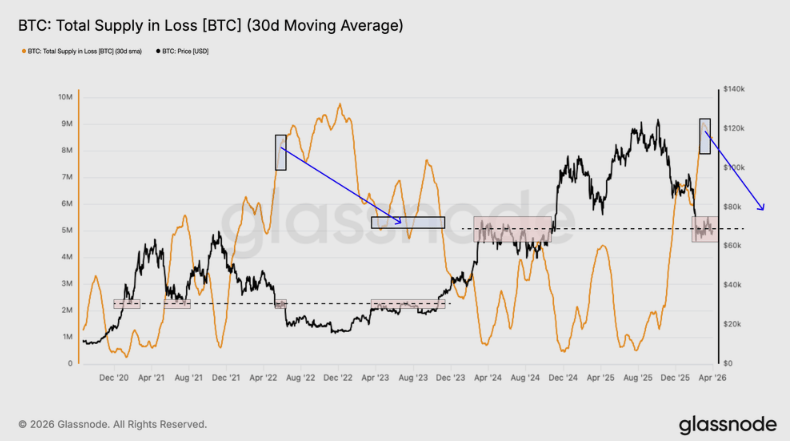
Glassnode’s weekly report on Wednesday highlighted that the Crypto King remains locked in a broad $60,000 to $70,000 range, with the market showing early signs of stabilization but not yet enough strength to break decisively in either direction.
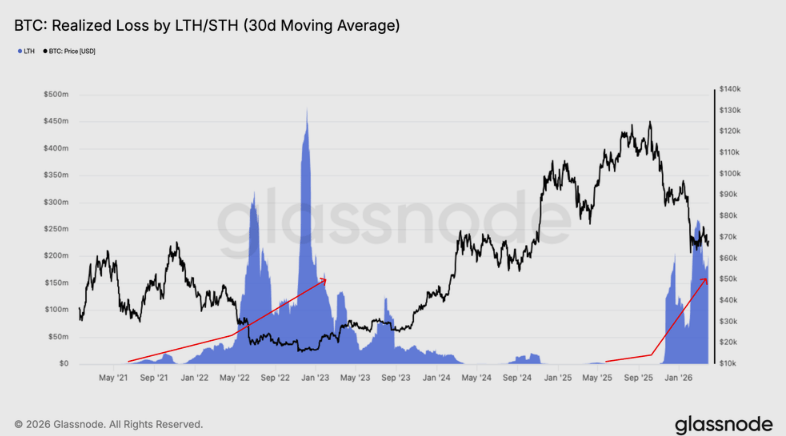
The report explained that the on-chain conditions still reflect ongoing repair, with supply in loss elevated and long-term holder capitulation not yet fully cooled, as shown in the chart below. In addition, spot demand is beginning to improve, suggesting sellers are no longer in full control.
The analyst said, “Across off-chain markets, the picture is similarly balanced. Corporate treasury demand has narrowed meaningfully, perpetual leverage has reset, implied volatility has softened, and dealer positioning has become less destabilizing. Together, these signals point to a market that is no longer in outright stress but is still searching for stronger conviction.”
“For now, Bitcoin appears to be trading through a redistribution phase rather than a clear trend. Until spot demand expands more meaningfully and overhead supply begins to clear, the range remains the dominant feature of the market,” concluded the analyst.
Bitcoin Price Forecast: BTC could extend a deeper correction if it breaks below key support
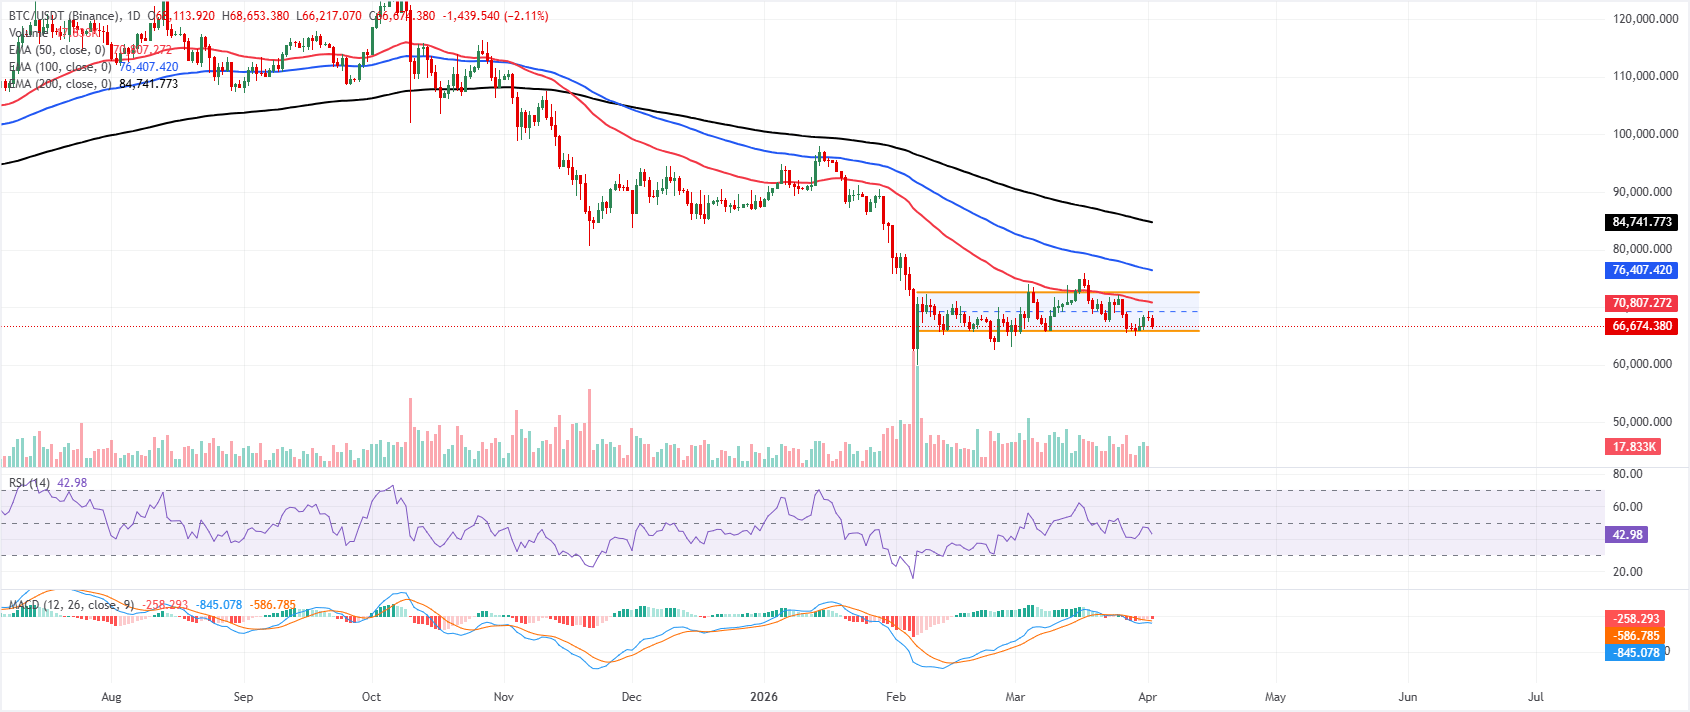
Bitcoin price is extending its correction, trading below $66,700 on Thursday, nearly erasing the recovery from earlier this week. The near-term bias is mildly bearish as price holds within a parallel channel and trades near its lower boundary around $65,900. The pair remains capped well below the clustered 50-day, 100-day and 200-day Exponential Moving Averages (EMAs) between roughly $70,800 and $84,800, which reinforces downside pressure despite the recent bounce attempts.
The daily chart Relative Strength Index (RSI) sits in the low-40s, consistent with weak momentum rather than a capitulation low, while the Moving Average Convergence Divergence (MACD) remains below the signal line and below the zero mark, with a negative histogram, indicating persistent selling pressure.
Immediate support is near the channel floor at $65,900, with a break exposing the key psychological level at $60,000.
On the upside, initial resistance emerges near the midpoint of the channel, around $69,200, just ahead of the channel top near $72,600, where the consolidating boundary tops roughly converge with the 50-day EMA to form a key barrier. A daily close above $72,600 would signal a bullish break from the sideways structure and open the door toward the 100-day EMA near $76,400, while sustained trade below $65,900 would extend the current corrective leg within the broader cycle.
(The technical analysis of this story was written with the help of an AI tool.)
Bitcoin, altcoins, stablecoins FAQs
Bitcoin is the largest cryptocurrency by market capitalization, a virtual currency designed to serve as money. This form of payment cannot be controlled by any one person, group, or entity, which eliminates the need for third-party participation during financial transactions.
Altcoins are any cryptocurrency apart from Bitcoin, but some also regard Ethereum as a non-altcoin because it is from these two cryptocurrencies that forking happens. If this is true, then Litecoin is the first altcoin, forked from the Bitcoin protocol and, therefore, an “improved” version of it.
Stablecoins are cryptocurrencies designed to have a stable price, with their value backed by a reserve of the asset it represents. To achieve this, the value of any one stablecoin is pegged to a commodity or financial instrument, such as the US Dollar (USD), with its supply regulated by an algorithm or demand. The main goal of stablecoins is to provide an on/off-ramp for investors willing to trade and invest in cryptocurrencies. Stablecoins also allow investors to store value since cryptocurrencies, in general, are subject to volatility.
Bitcoin dominance is the ratio of Bitcoin's market capitalization to the total market capitalization of all cryptocurrencies combined. It provides a clear picture of Bitcoin’s interest among investors. A high BTC dominance typically happens before and during a bull run, in which investors resort to investing in relatively stable and high market capitalization cryptocurrency like Bitcoin. A drop in BTC dominance usually means that investors are moving their capital and/or profits to altcoins in a quest for higher returns, which usually triggers an explosion of altcoin rallies.
Recommended Articles


