Pi Network Price Forecast: PI maintains bullish momentum above $0.20

Source Fxstreet
  • Pi Network is up nearly 3% on Monday, holding above $0.2100 after a 25% rally last week.
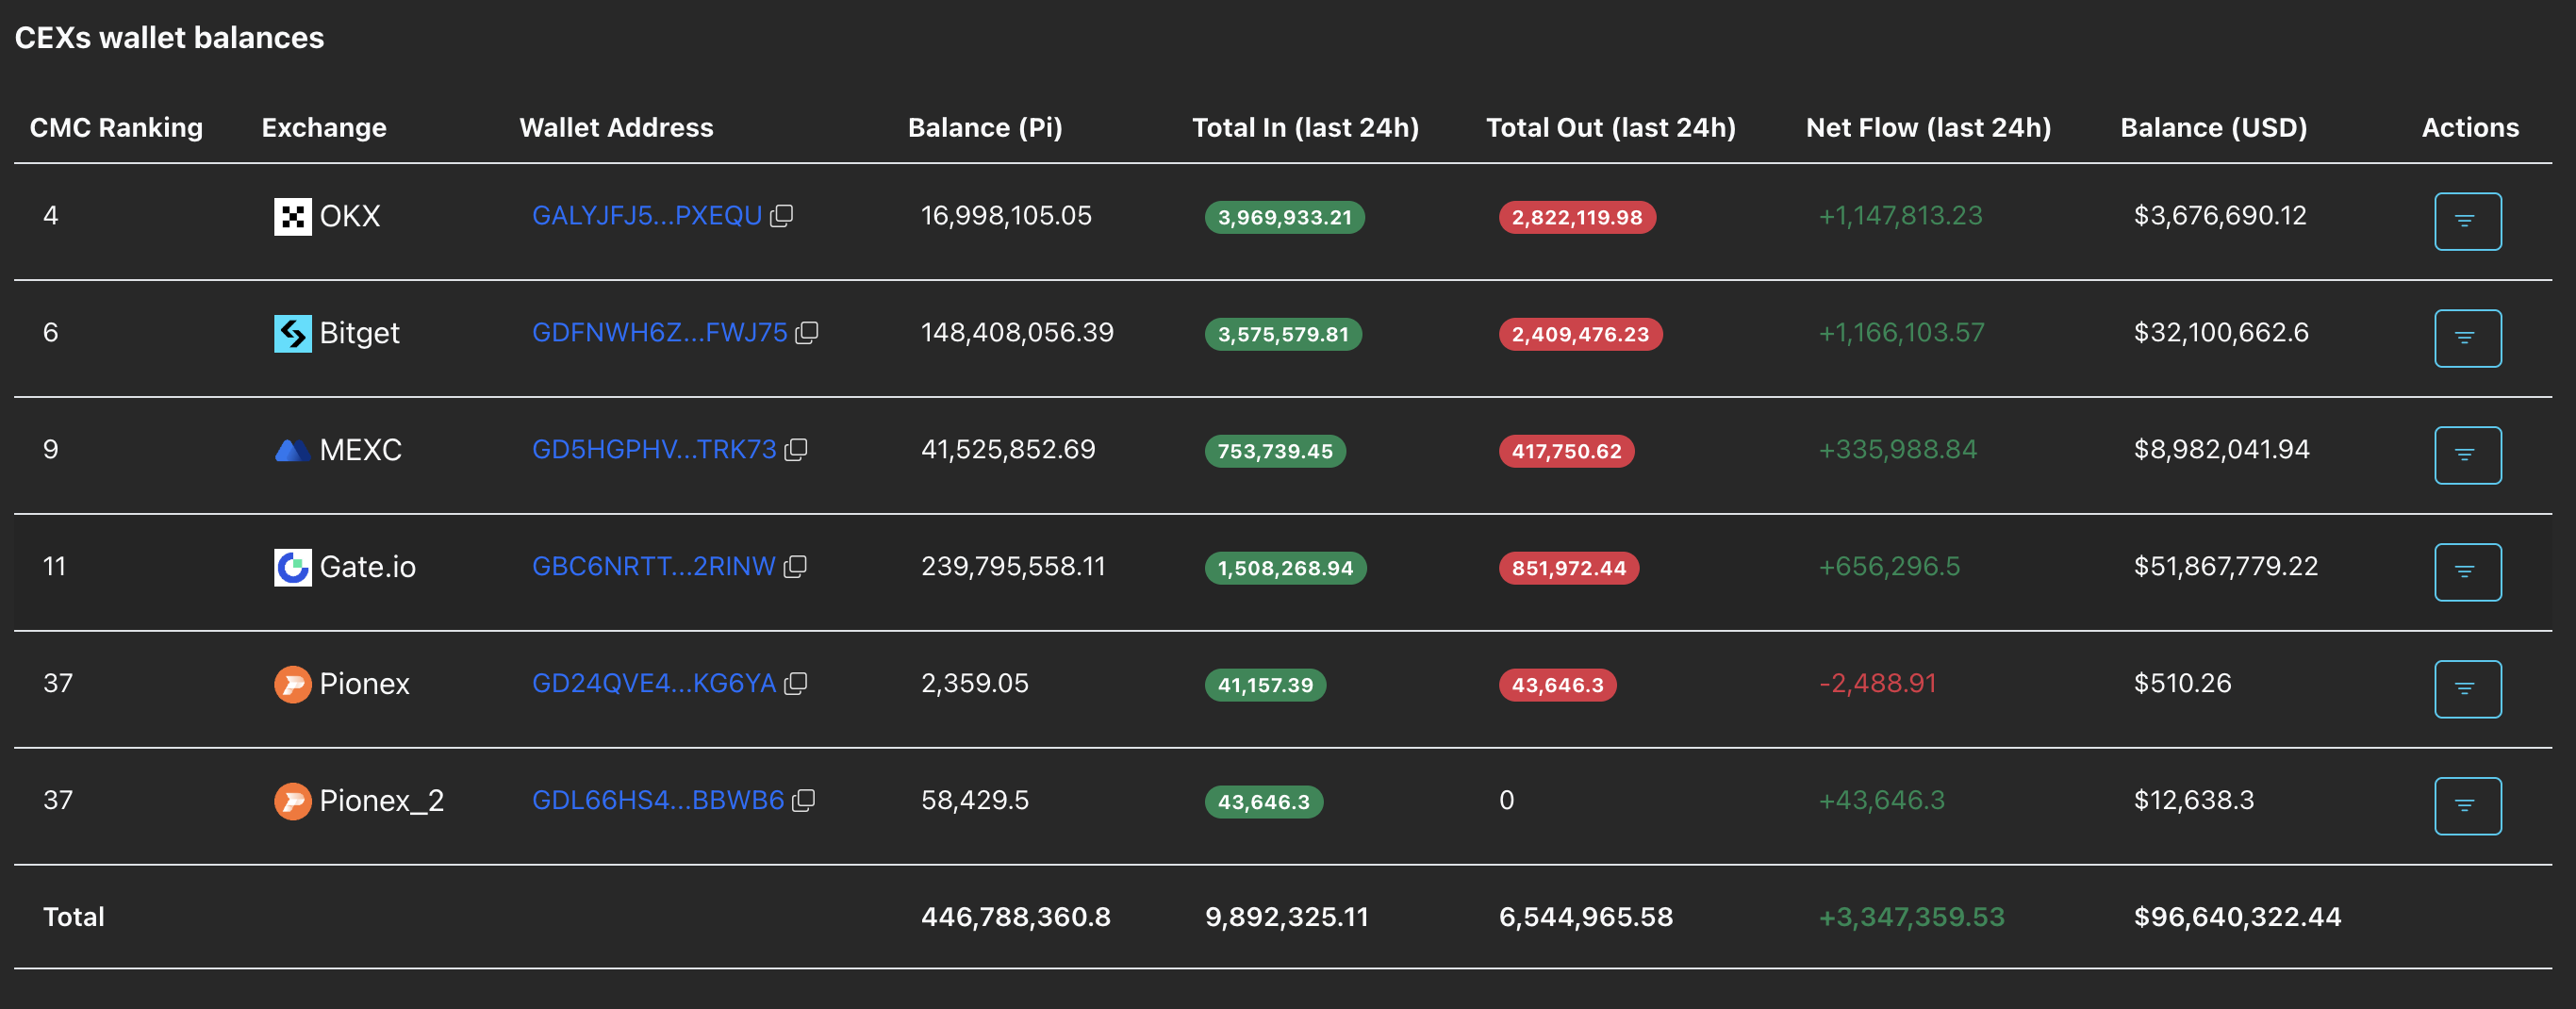
  • PiScan data shows a short-term profit-booking phase, with exchanges recording over 3 million PI token deposits in 24 hours.
  • The technical outlook for PI remains broadly bullish as it holds above the 100-day EMA.

Pi Network (PI) edges higher by 3% at press time on Monday, holding ground above $0.2100 after last week’s 25% rally. Data shows that retail demand is shifting toward profit-taking, as evidenced by massive deposits of over 3 million PI tokens over the last 24 hours. The technical outlook for PI remains bullish, with demand expected to sustain ahead of Pi Day on March 14.

Could retail demand sustain PI above $0.20 ahead of Pi Day?

Retail investors are moving forward to book short-term profits after last week’s recovery run. PiScan data shows 3.34 million PI tokens deposited on supporting Centralized Exchanges (CEXs), which typically reflects reduced confidence in the rally and often signals a local top.

However, the demand spike for PI aligns with the upcoming Pi Day on March 14, repeating a behavior seen a week before its Open Network anniversary, which was on February 20. Considering the demand holds till Pi Day, the PI token could extend its recovery this week.

CEXs PI reserve data. Source: PiScan

Technical outlook: Will PI Network rally hit the 200-day EMA?

Pi Network is inching closer to $0.2200 at press time on Monday, recovering after Sunday’s 10% dip, which aligned with short-term profit-taking by mainnet users. Still, the near-term tone for PI remains bullish as it sustains above the 100-day Exponential Moving Average (EMA) at $0.1973.

To extend recovery to its 200-day EMA at $0.2854, PI should exceed its Friday high at $0.2396.

The technical indicators on the daily chart suggest that the trend momentum is reinforcing an upside bias. The Moving Average Convergence Divergence (MACD) rises above its signal line, while the Relative Strength Index (RSI) at 64 hovers close to the overbought threshold, indicating continued bullish pressure.

Chart Analysis PI/USD (baha Crypto)
PI/USD daily price chart.

On the downside, the immediate support cluster is the $0.2000 psychological level and the 100-day EMA at $0.1973, followed by the 50-day EMA at $0.1813.

(The technical analysis of this story was written with the help of an AI tool.)

Disclaimer: For information purposes only. Past performance is not indicative of future results.
placeholder
Ethereum (ETH) Price Closes Above $3,900 — Is a New All-Time High Possible Before 2024 Ends?Once again, the price of Ethereum (ETH) has risen above $3,900. This bounce has hinted at a further price increase for the altcoin before the end of the year.
Author  Beincrypto
Dec 17, 2024
Once again, the price of Ethereum (ETH) has risen above $3,900. This bounce has hinted at a further price increase for the altcoin before the end of the year.
placeholder
ECB Policy Outlook for 2026: What It Could Mean for the Euro’s Next MoveWith the ECB likely holding rates steady at 2.15% and the Fed potentially extending cuts into 2026, EUR/USD may test 1.20 if Eurozone growth proves resilient, but weaker growth and an ECB pivot could pull the pair back toward 1.13 and potentially 1.10.
Author  Mitrade
Dec 26, 2025
With the ECB likely holding rates steady at 2.15% and the Fed potentially extending cuts into 2026, EUR/USD may test 1.20 if Eurozone growth proves resilient, but weaker growth and an ECB pivot could pull the pair back toward 1.13 and potentially 1.10.
placeholder
WTI climbs to $76.00, eyes one-year high amid rising tensions in the Middle EastWest Texas Intermediate (WTI) US Crude Oil prices attract fresh buyers on Wednesday and climb back closer to the highest level since January 2025, touched the previous day.
Author  FXStreet
Mar 04, Wed
West Texas Intermediate (WTI) US Crude Oil prices attract fresh buyers on Wednesday and climb back closer to the highest level since January 2025, touched the previous day.
placeholder
Gold rises as safe-haven demand increases on Iran warGold price (XAU/USD) extends its gains for the second successive session on Thursday as traders seek safety amid the ongoing war in the Middle East.
Author  FXStreet
Mar 05, Thu
Gold price (XAU/USD) extends its gains for the second successive session on Thursday as traders seek safety amid the ongoing war in the Middle East.
placeholder
US Dollar Index gathers strength to near 99.00 on Middle East tensions, robust US services data The US Dollar Index (DXY), an index of the value of the US Dollar (USD) measured against a basket of six world currencies, currently trades near 99.00 during the early European trading hours on Thursday. The DXY edges higher amid uncertainty and persistent geopolitical risks in the Middle East.
Author  FXStreet
Mar 05, Thu
The US Dollar Index (DXY), an index of the value of the US Dollar (USD) measured against a basket of six world currencies, currently trades near 99.00 during the early European trading hours on Thursday. The DXY edges higher amid uncertainty and persistent geopolitical risks in the Middle East.
goTop
quote