

Monero Price Forecast: XMR gathers steam amid rising whale interest
- Monero rises 5% on Wednesday, building on the rebound from a crucial support level the previous day.
- Derivatives data show an increase in Open Interest amid rising whale interest, suggesting further upside.
- The technical outlook for Monero shows a bullish bias, targeting the 200-day EMA at $375.
Monero (XMR) stages a recovery with 5% gains at press time on Wednesday, extending the 4% rebound from the $300 mark. The privacy coin rebuilds bullish conviction as the Open Interest and interest of large wallet investors, commonly called whales, are rising. Technically, XMR could extend its recovery toward the 200-day Exponential Moving Average (EMA) at $375.
Bulls tighten grip on Monero derivatives
Monero regains strength in the derivatives market, attracting traders' attention in broadly risk-averse market conditions. CoinGlass data shows XMR futures Open Interest (OI) is at $99.00 million on Wednesday, up more than 6% in the last 24 hours, reflecting the increased notional value of outstanding XMR derivatives contracts. Typically, an increase in OI suggests positional buildup or elevated leverage, which could be on either side of the spectrum.
However, the long-to-short ratio at 1.0354, coupled with short liquidations of $91,640 over the last 24 hours, which outpaced long liquidations of $14,300, skews the data bullish.
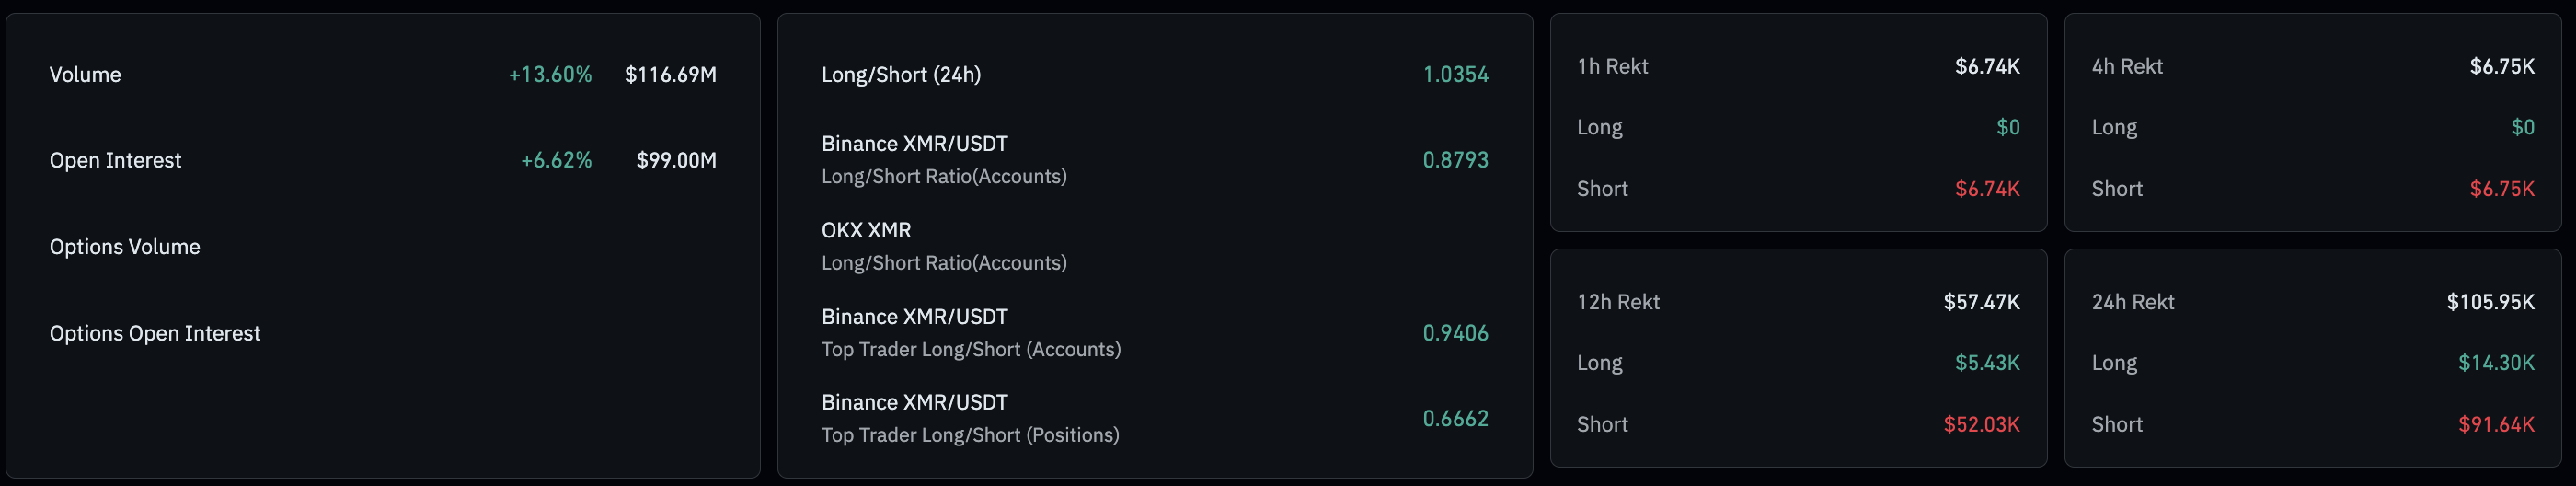
On the other hand, CryptoQuant data shows large whale orders executed in the futures market, based on average order size, suggesting that large wallet investors are recalibrating their interest in Monero.
Monero’s rebound from $300 strengthens upside bias
Monero bounced 4% higher from the 78.6% Fibonacci retracement level at $300 on Tuesday, measured from the August 15 low at $231 to the January 14 high at $799. The rebound reflects intense demand present near the $300 mark, resulting in a second bounce back in February, suggesting the possibility of a double-bottom pattern.
Despite the second leg being visibly higher than the first, the potential neckline would coincide with the 61.8% Fibonacci retracement level at $370, last tested on February 14.
However, for a sustained recovery, Monero should exceed the 200-day EMA at $375, which could open the door to the 50-day EMA at $389 and the 50% Fibonacci retracement level at $429. The presence of multiple resistances in the short-term could cap Monero’s recovery, limiting the upside.
Additionally, the declining 50-day EMA is approaching the 200-day EMA, increasing the likelihood of a Death Cross pattern. The momentum indicators on the daily chart suggest fading bearish pressure but not a clear trend reversal. The Moving Average Convergence Divergence (MACD) rises above its signal line, sustaining an upward trend, while the Relative Strength Index (RSI) has recovered toward 44 from oversold territory.
On the downside, a sustained break below $300 would expose the 100% Fibonacci retracement level and prior base near $230.
(The technical analysis of this story was written with the help of an AI tool.)
Recommended Articles


