

Cardano’s Trading Activity Crashes to a 6-Month Low — Can ADA Still Attempt a Reversal?
The Cardano price has declined sharply in recent months, reflecting weakening investor participation. This decline did not happen alone. Cardano’s on-chain trading activity has also collapsed during the same period. Decentralized exchange trading volume has dropped by over 94% since August, hitting a six-month low.
Yet despite this collapse in participation, technical charts now show early signs of a possible reversal. This creates a conflict between weakening network activity and improving price structure.
On-Chain Trading Activity Collapse Confirms Weak Trend
Cardano’s weekly decentralized exchange trading volume has dropped dramatically over the past six months. In August 2025, weekly volume peaked at 19,103,979 ADA. By February 16, 2026, this figure had fallen to just 1,176,723 ADA, highlighted exclusively by BeInCrypto’s Dune Dashboard.
This represents a 94% collapse in on-chain trading. This is also indicative of the low on-chain participation, as aggressively traded coins are often associated with sharp price moves.
Want more token insights like this? Sign up for Editor Harsh Notariya’s Daily Crypto Newsletter here.
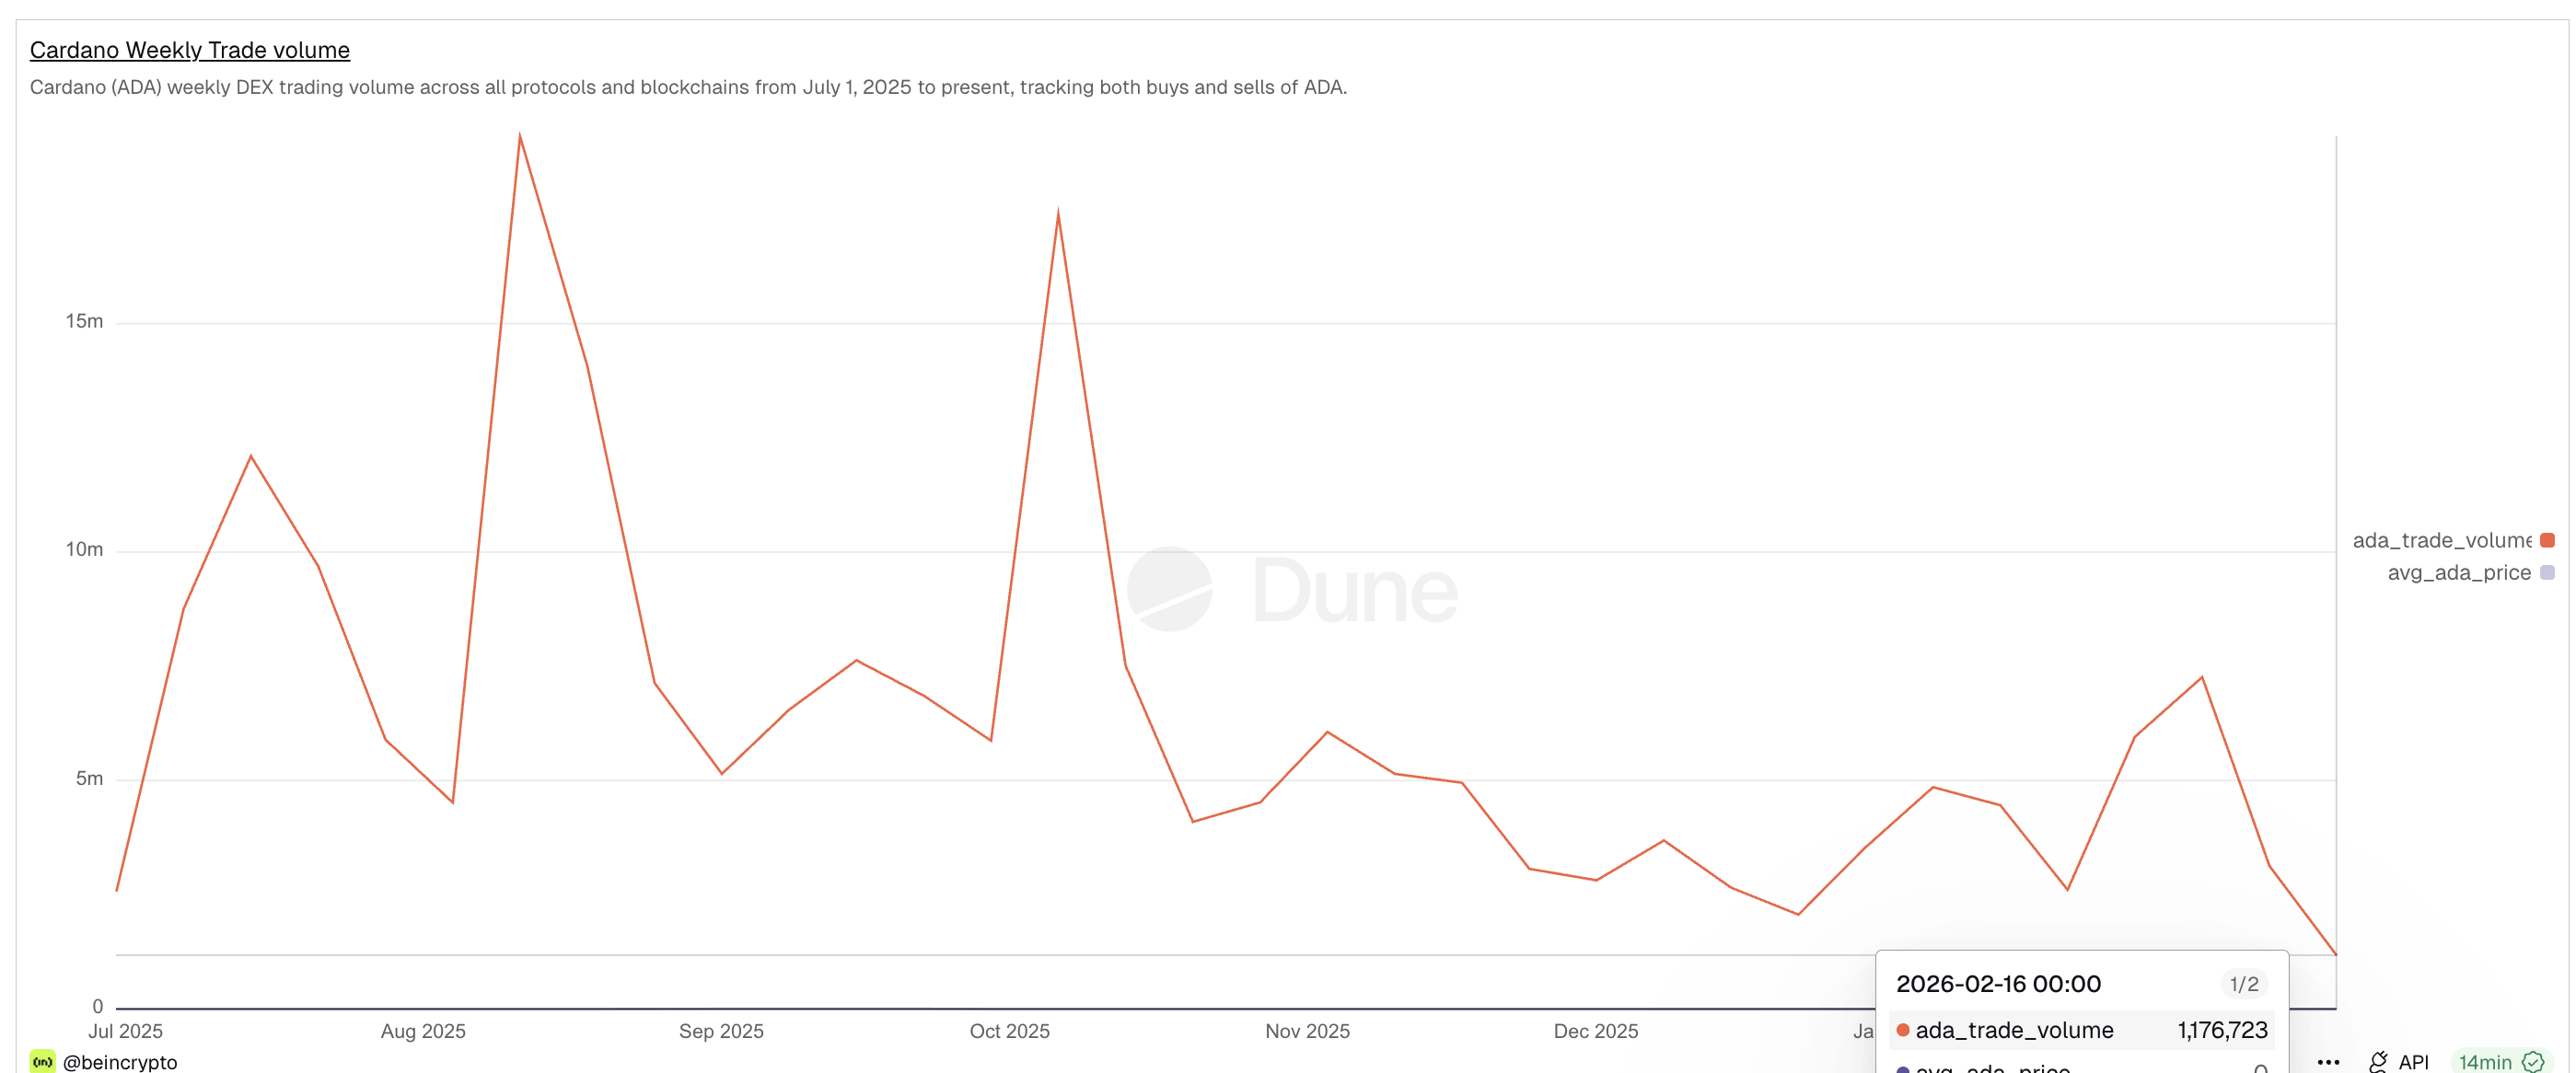 Weak DEX Trading Volume: Dune
On-chain trading volume measures real buying and selling happening directly on the blockchain. It reflects user participation and demand. When volume falls this sharply, it shows fewer investors are actively trading the asset.
Cardano’s price has mirrored this weakness. ADA has dropped roughly 68% over the same six-month period. This confirms the downtrend was supported by declining participation and demand. However, price structure now shows early signs that this trend may be changing.
Bullish Price Pattern Emerges, But Profit-Taking Risk Remains
Cardano is currently forming an inverse head-and-shoulders pattern on the daily chart. This is a bullish reversal pattern that appears when selling pressure weakens, and buyers begin slowly regaining control.
The left shoulder formed in January. The head formed in early February. The right shoulder has now formed near similar levels, validating the structure. However, to confirm the breakout, the daily Cardano price candle must close above $0.30.
Momentum indicator, in the form of RSI, supports this formation. The Relative Strength Index, or RSI, has formed a bullish divergence. Between December 31 and February 18, Cardano’s price made a lower low. But during the same period, RSI made a higher low. This shows selling pressure is weakening even as the price tests new lows. It confirms buyers are slowly returning.
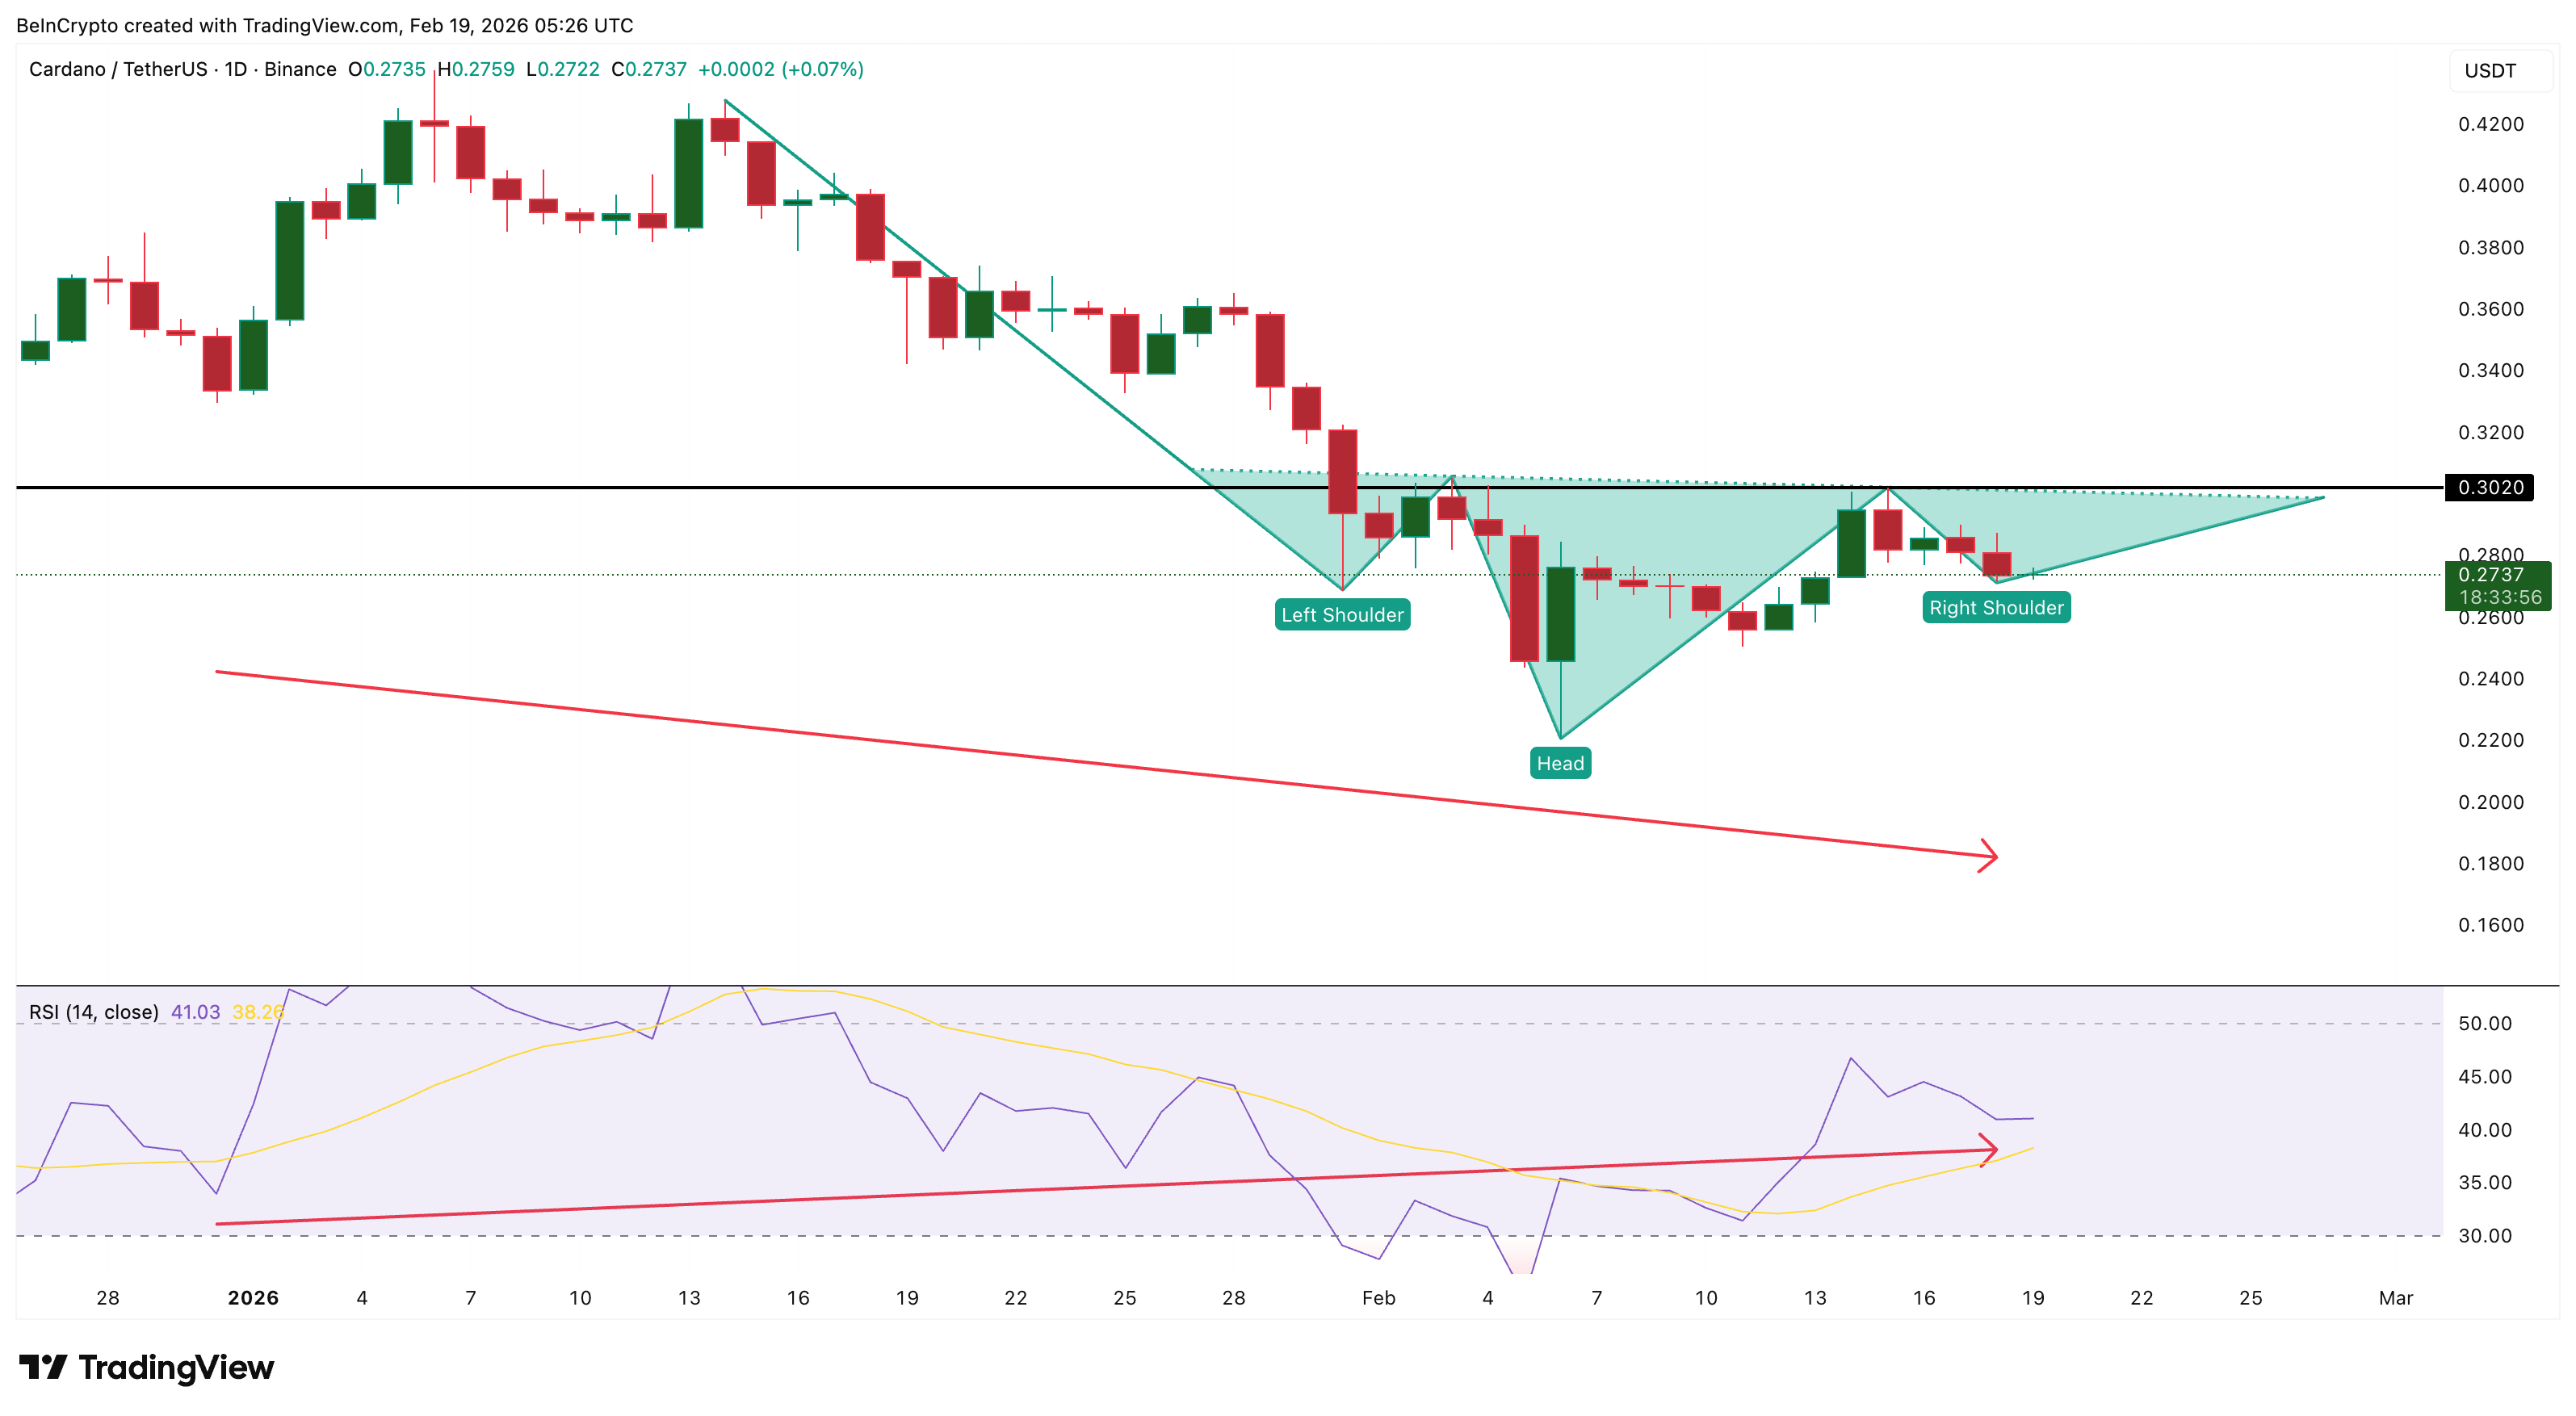 Bullish Divergence: TradingView
However, another on-chain metric introduces risk. The percentage of Cardano supply in profit dropped sharply from 27% to just 6% during the recent decline, from late January to mid-February. It has now started rising again and currently sits near 10%.
This increase shows more investors are returning to profit. While this can support recovery, it also creates selling risk. When holders return to profit, many choose to sell and secure gains. For example, on February 15, profitable supply rose near 11%. Cardano’s price dropped from $0.29 to $0.27 soon after. This was a 7% decline in a single trading session.
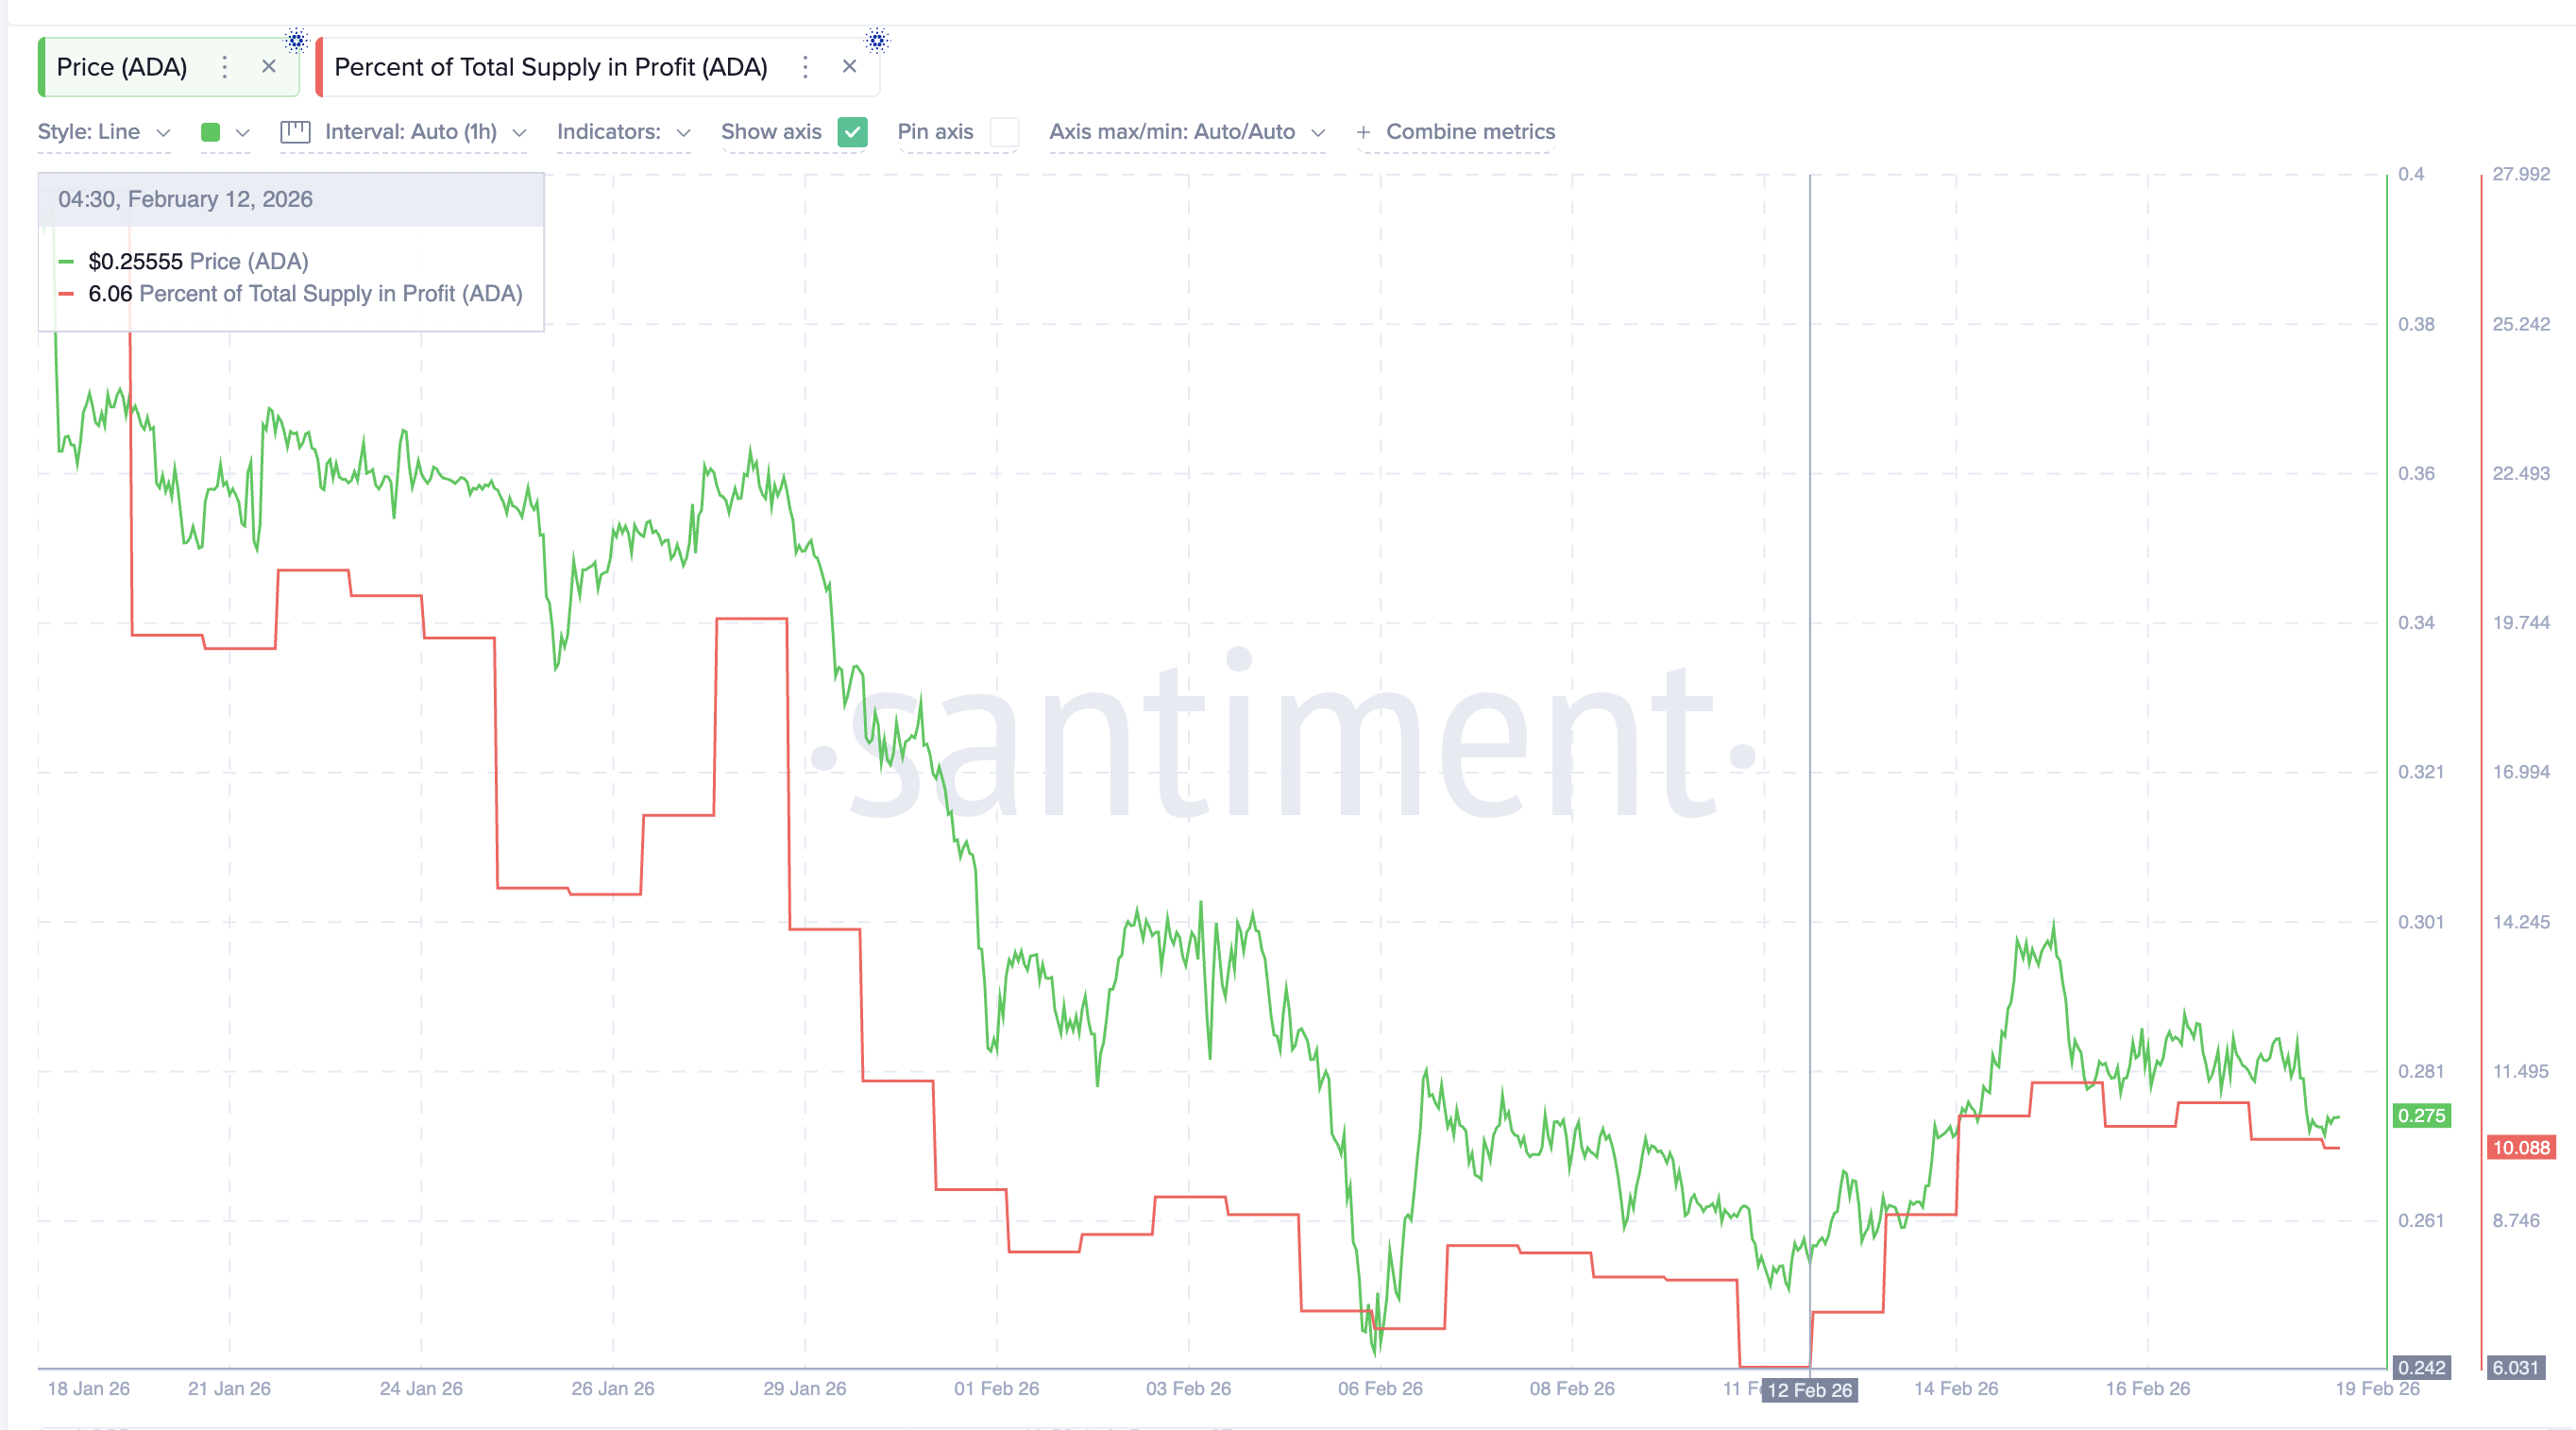 Profitability Rises Again: Santiment
This shows rising profitability can trigger selling pressure even during recovery attempts, making support and resistance levels all the more important.
Cardano Price Faces Critical Breakout Level at $0.30
Cardano now sits near its most important resistance level. The neckline of the inverse head and shoulders pattern is located at $0.30. This level will decide the next major move.
If Cardano breaks above $0.30 and closes above it, the bullish pattern would be confirmed. Based on the structure, this could push ADA toward $0.40 and $0.41. This would represent a potential 35% to 38% rally from the neckline.
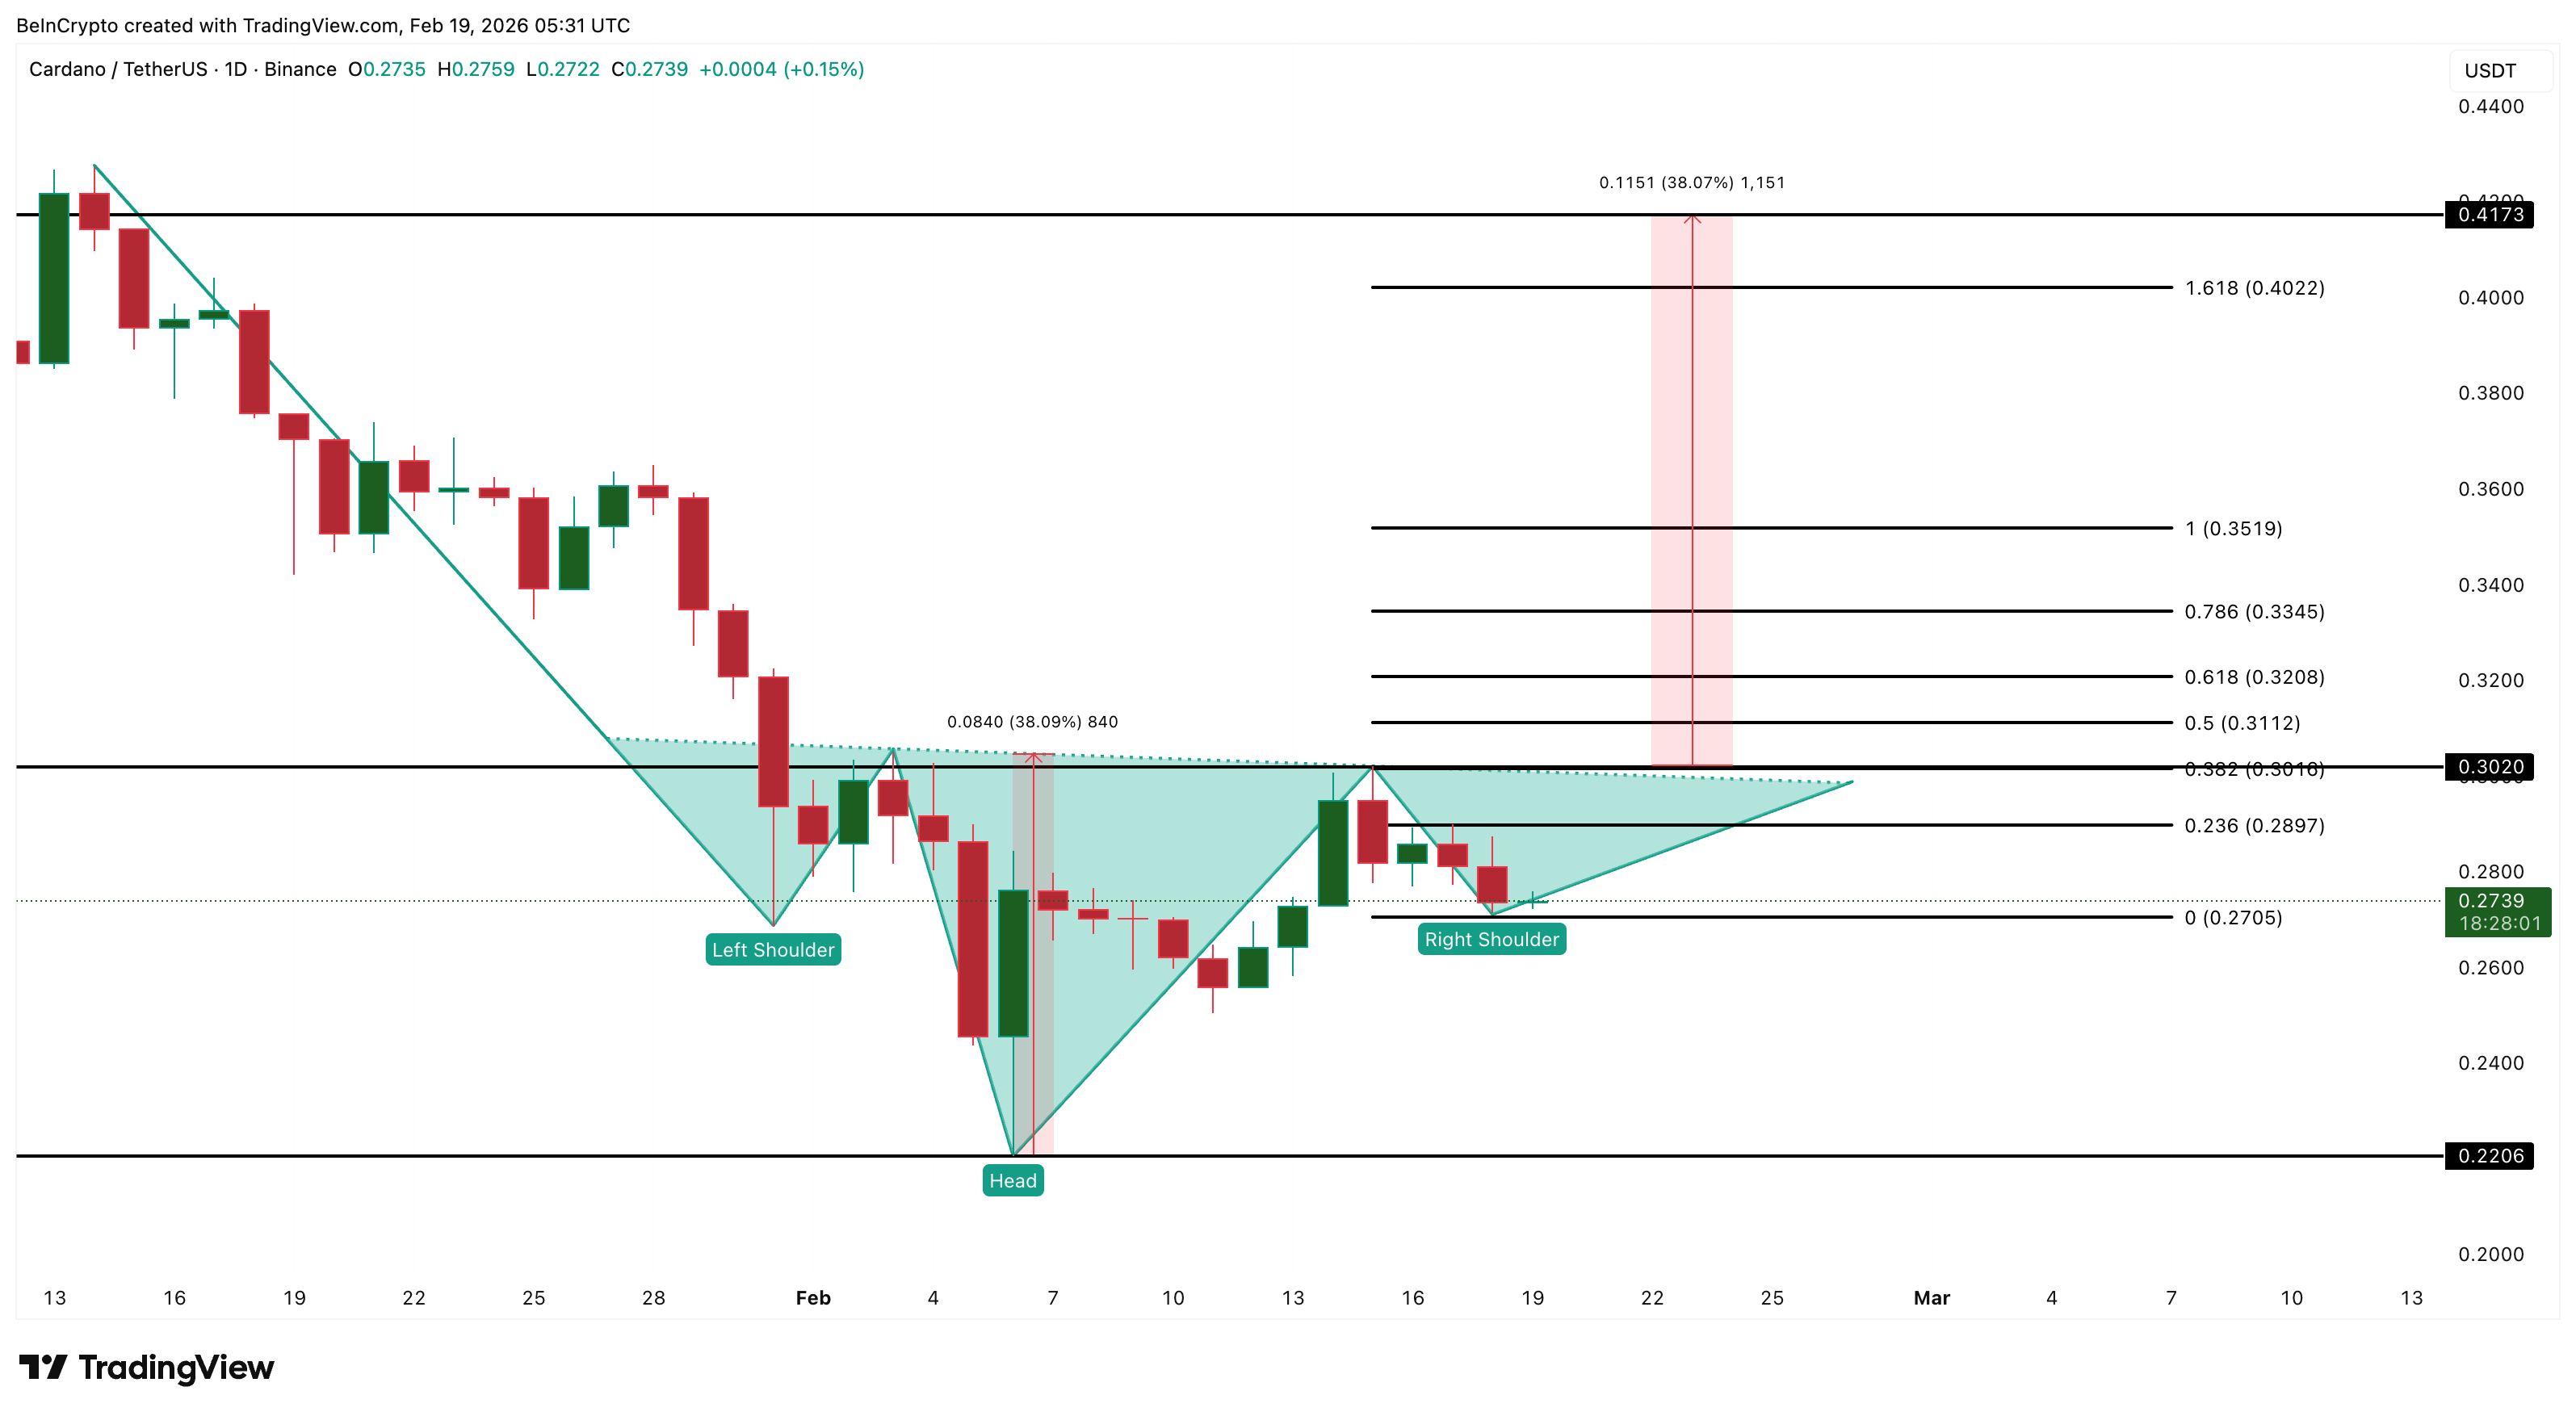 Cardano Price Analysis: TradingView
However, failure to break this level would weaken the recovery attempt. If Cardano falls below $0.27 (led by possible profit booking), the bullish structure would begin weakening. A further drop below $0.22 would completely invalidate the pattern and confirm continued downside.
For now, Cardano sits at a critical decision point. On-chain trading confirms participation has collapsed. But technical indicators suggest a possible reversal. The next move above $0.30 or below $0.27 will determine whether Cardano begins a true recovery or resumes its longer-term decline.
Recommended Articles


